
FINANCIAL MARKETS REVIEW
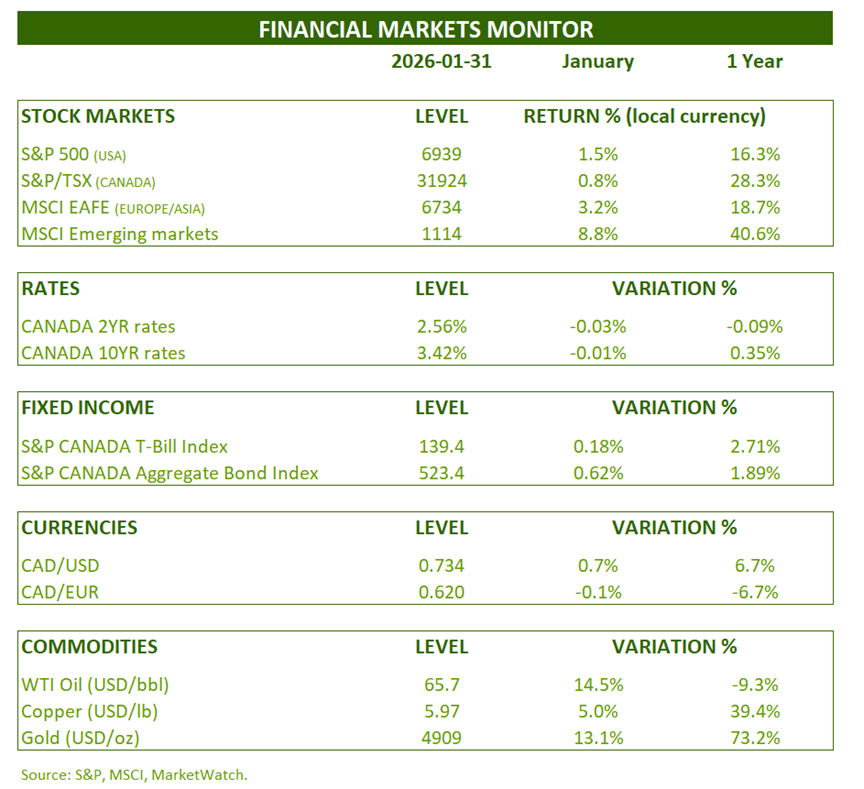
True to form, stock markets continued to perform well. Emerging markets benefited from the weak US dollar, generating an 8.8% return for the month. Europe and Asia also fared well, with a 3.2% gain. In the Americas, performance was more modest, with the S&P 500 index returning 1.5% and Canada 0.8%.
A shift in performance pattern is beginning to take place. Europe, Asia, and emerging markets have been outperforming the US stock market for some time now. Small-cap stocks are outperforming, while technology stocks have ceased to outperform since July.

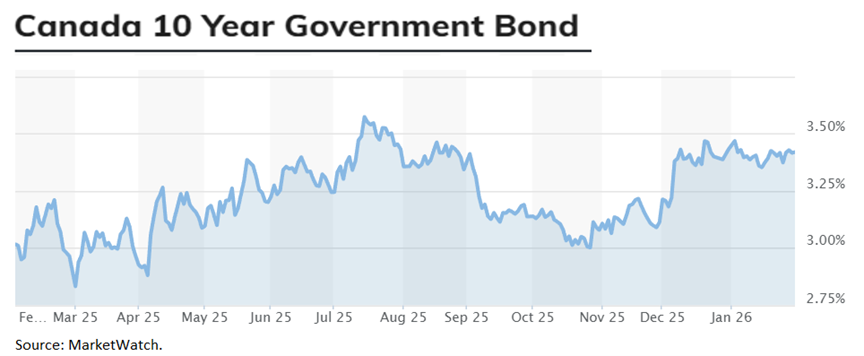
Two-year and ten-year interest rates ended the month with no significant change. As a result, the Canadian bond index performed slightly better (0.62%). Oil and gold both had an excellent month with respective returns of 14.5% and 13.1%.
OUTLOOK:
Economy:
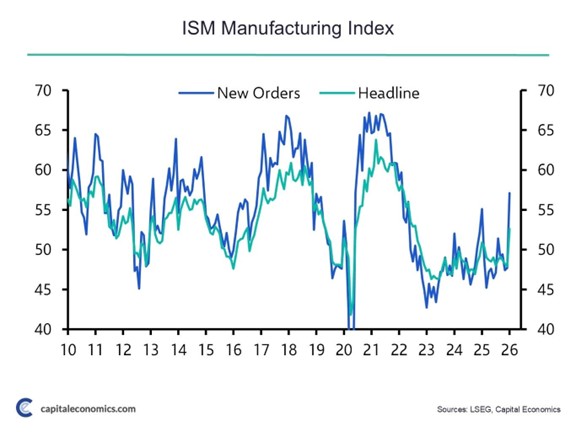
Central banks began their easing cycles roughly 18 months ago. This is about the time it takes for these rate cuts to trickle down into the economy. Recent news indicates that this is starting to materialize. The ISM Manufacturing Purchasing Managers’ Index (PMI) data points in this direction. The composite index, as well as the new orders sub-component, are at their highest levels since 2022. Canada, with its first reading of growth (Manufacturing PMI) in 12 months, appears to be emerging from its sluggishness.
ISM Manufacturing PMI (United States):
The Economic Cycle Research Institute’s Leading GDP Index also points to a strengthening of economic growth in the United States.
ECRI Leading GDP Index (United States):

The weakness of the US dollar is also a positive sign. Indeed, the following chart illustrates the strong relationship between the US dollar and the global economy. As the dollar is central to the global financial system, its weakness often translates into cheaper goods and financing for other countries.
US Dollar Index (Trade Weighted) and G20 GDP Growth:

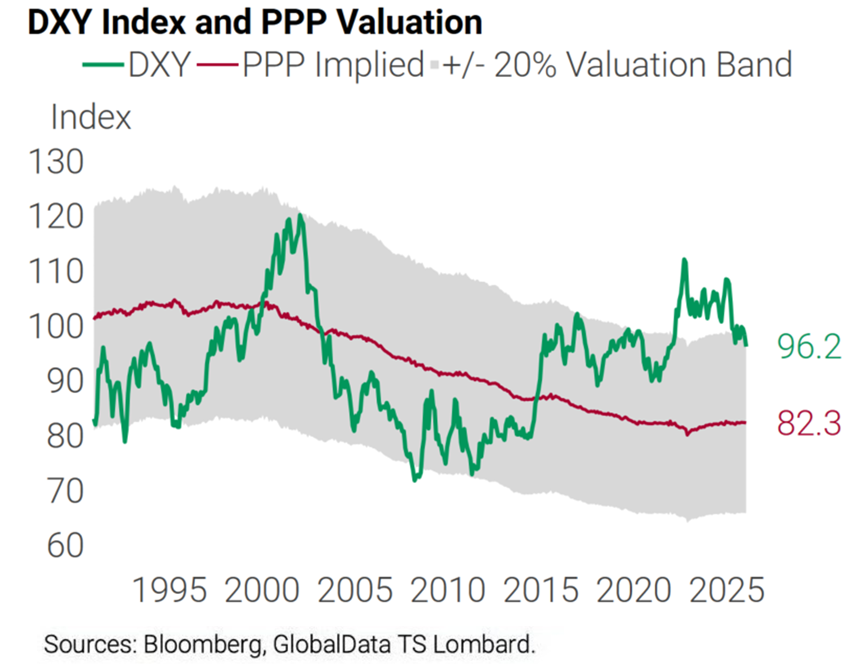
On a fundamental basis, the value of the US dollar (trade weighted) is significantly overvalued. This, however, is a very long-term relationship.
US Dollar Index (Trade Weighted) vs. Long-Term Fundamental Value:
Fixed Income:
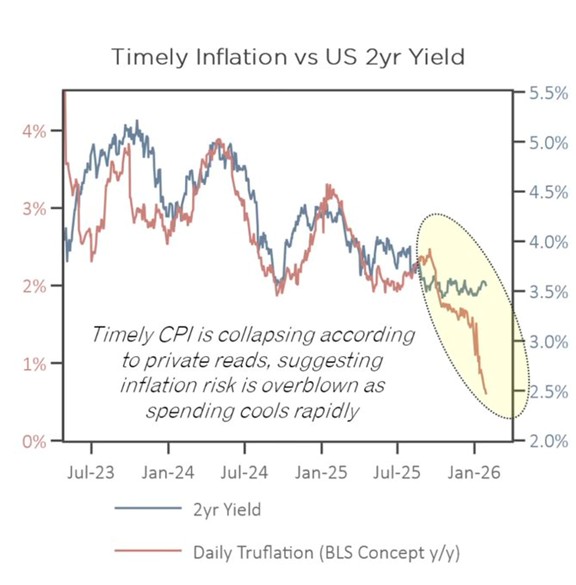
The Truflation website is a price data aggregator that calculates the inflation rate in real time. This allows users to observe trends before the official CPI data is released. Recently, prices have fallen sharply, favoring interest rate cuts.
Truflation Inflation Indicator and 2-Year US Treasury Rate:
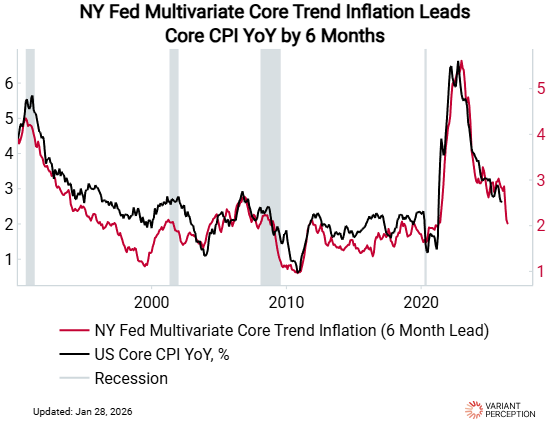
The New York Federal Reserve’s Leading Index (6-month) of Core Inflation reaches a similar conclusion. This could make things easier for the new Chairman of the Federal Reserve Board of Governors, who may want to please his boss, Donald Trump.
New York Federal Reserve Leading Index (6-month) and Core Inflation (US):
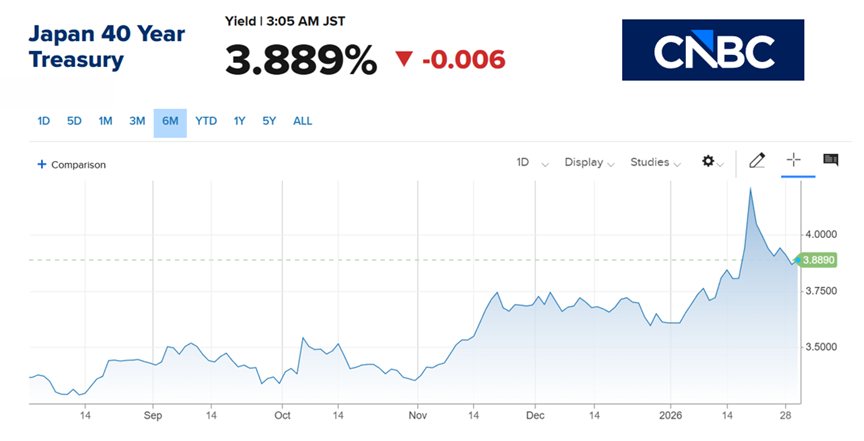
The surge in long-term Japanese interest rates is less good news for governments. For ages, speculators have been borrowing in Japan (where rates are the lowest in the G7) hoping to earn higher returns elsewhere. This strategy is called carry trade. Borrowing costs are becoming less and less attractive. Similarly, Japanese institutional investors were buying US bonds due to their high yields. All of this created demand for US bonds. This demand is gradually disappearing.
Interest rates on 40-year Japanese bonds:
We can see that the term premium for investing is approaching 1%, compared to -1% in 2023. The rise in rates in Japan is contributing to upward pressure on rates worldwide. This is good news for long-term investors.
Components of the 10-year US Treasury yield:

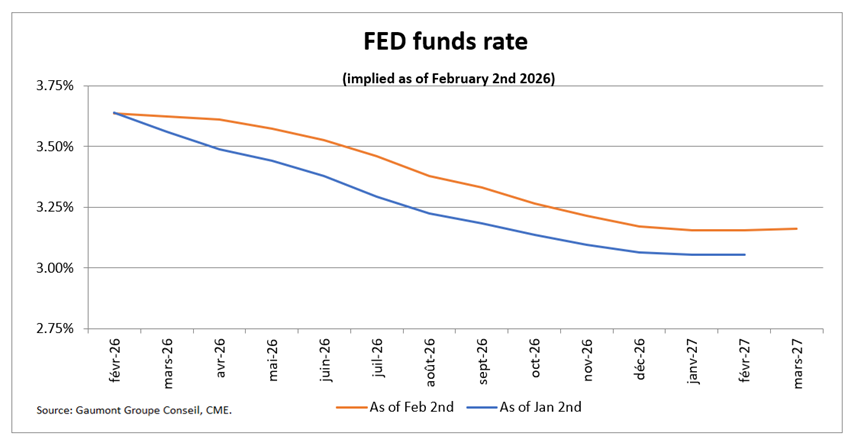
Expectations of rate cuts by the Fed decreased slightly in January. Indeed, cuts of 0.47% are projected by December 2026, compared to 0.57% at the beginning of January.
In Canada, expectations of interest rate cuts are zero by the end of 2026. In fact, the market is pricing in an 18% probability of a 25-basis-point increase this year.
Short-term implied interest rates (United States):
Stock Markets:
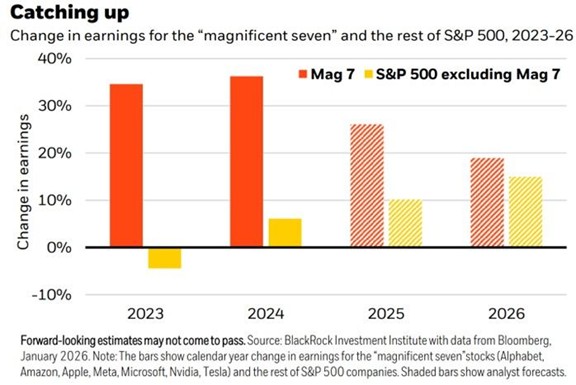
Despite Donald Trump’s tariffs and the global geopolitical context, corporate profits continue to grow strongly. In the United States, S&P 500 profits are projected to grow by 17% in 2026 (after 14% in 2025). The following chart shows that, although still higher, the growth of the MAG7 index is gradually converging with the rest of the index. The gap is narrowing. This is undoubtedly related to the stagnation of the outperformance of technology stocks for over a year.
What is particularly striking in this context is that profit margins continue to increase. Companies must take advantage of this while it lasts, as it cannot continue indefinitely. In a capitalist world, high margins generate competition. These record margins partly explain the strong profit growth.
S&P 500 Profit Margin (United States):

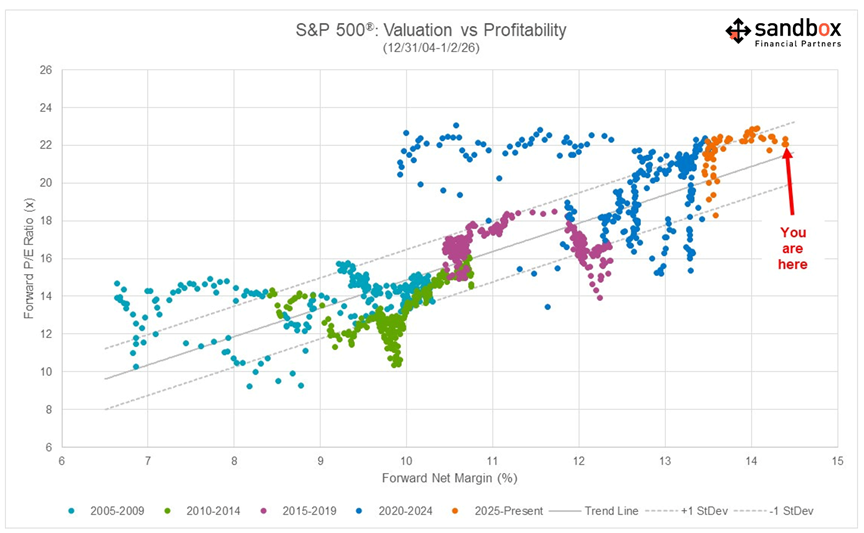
High valuation ratios can also be partly explained by companies’ healthy profit margins.
S&P 500 Price-to-Earnings Ratio and Profit Margin (United States):
After six months of strong returns, investor expectations are very high, leaving little room for disappointment. Retail investors continue to inject record amounts of capital into the stock market. Conversely, corporate executives are selling at the fastest pace in five years.
Stock Market Behavior of Retail Investors and Corporate Executives (United States):

CONCLUSION :
The year 2026 begins with strong stock market returns, and this is expected to continue. However, a correction is possible given the overly positive investor sentiment. Maintain a diversified portfolio of quality securities at reasonable valuations. Rising interest rates make the fixed-income sector even more attractive.
Frédéric Mercier CFA, SIPC
Director – Financial markets