
FINANCIAL MARKETS REVIEW
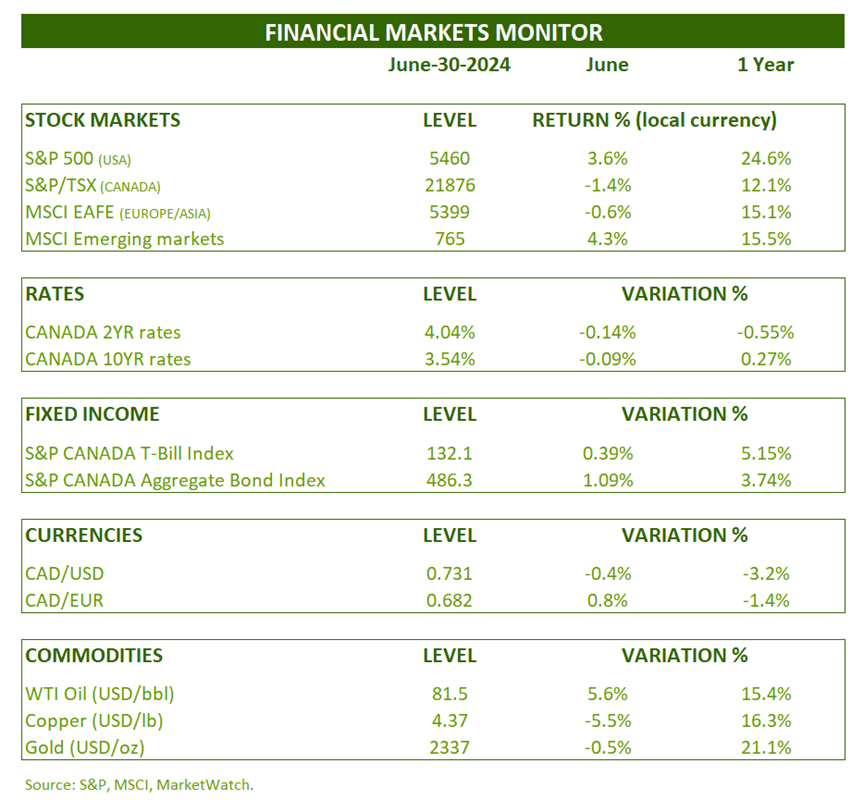
A new month and a new record for the flagship American index. Indeed, the S&P 500 index increased by 3.6% in June. The technology sector sub-index, for its part, increased by more than 9%. In Canada and Europe-Asia, performance was slightly negative. The best return of the month went to emerging markets with a performance of 4.3%.

The rise in inflation continues to slow across the world. This allowed the Bank of Canada and the European Central Bank to lower their rates for the first time since the pandemic. The Federal Reserve is expected to follow suit by the end of the year.
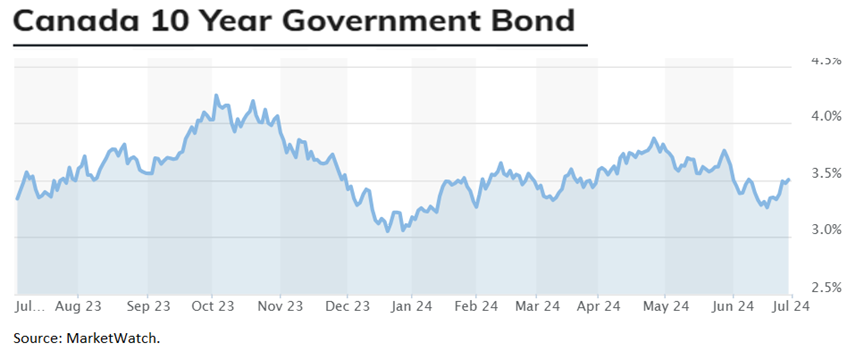
The 2-year and 10-year maturity rates fell by 0.14% and 0.09% respectively in June. The return on the Canadian bond index was 1.09%.
OUTLOOK:
Economy :
Leading labor market indicators have been pointing to rising unemployment for some time, such as the following chart from the NFIB (National Federation of Independent Business).
Small business hiring intentions and unemployment rate (United States):

However, the data on unemployment and its providers are finally showing signs of deterioration. This could make the task of the Federal Reserve easier. Remember that employment is the last sector to be affected by a restrictive monetary policy. In Canada, short-term mortgage rates (compared to 30-year maturities in the USA) for households have meant that the cycle is more advanced. Unemployment has been on the rise for almost 2 years now in Canada, while it is just starting to increase south of the border.
Employment insurance beneficiaries (United States):

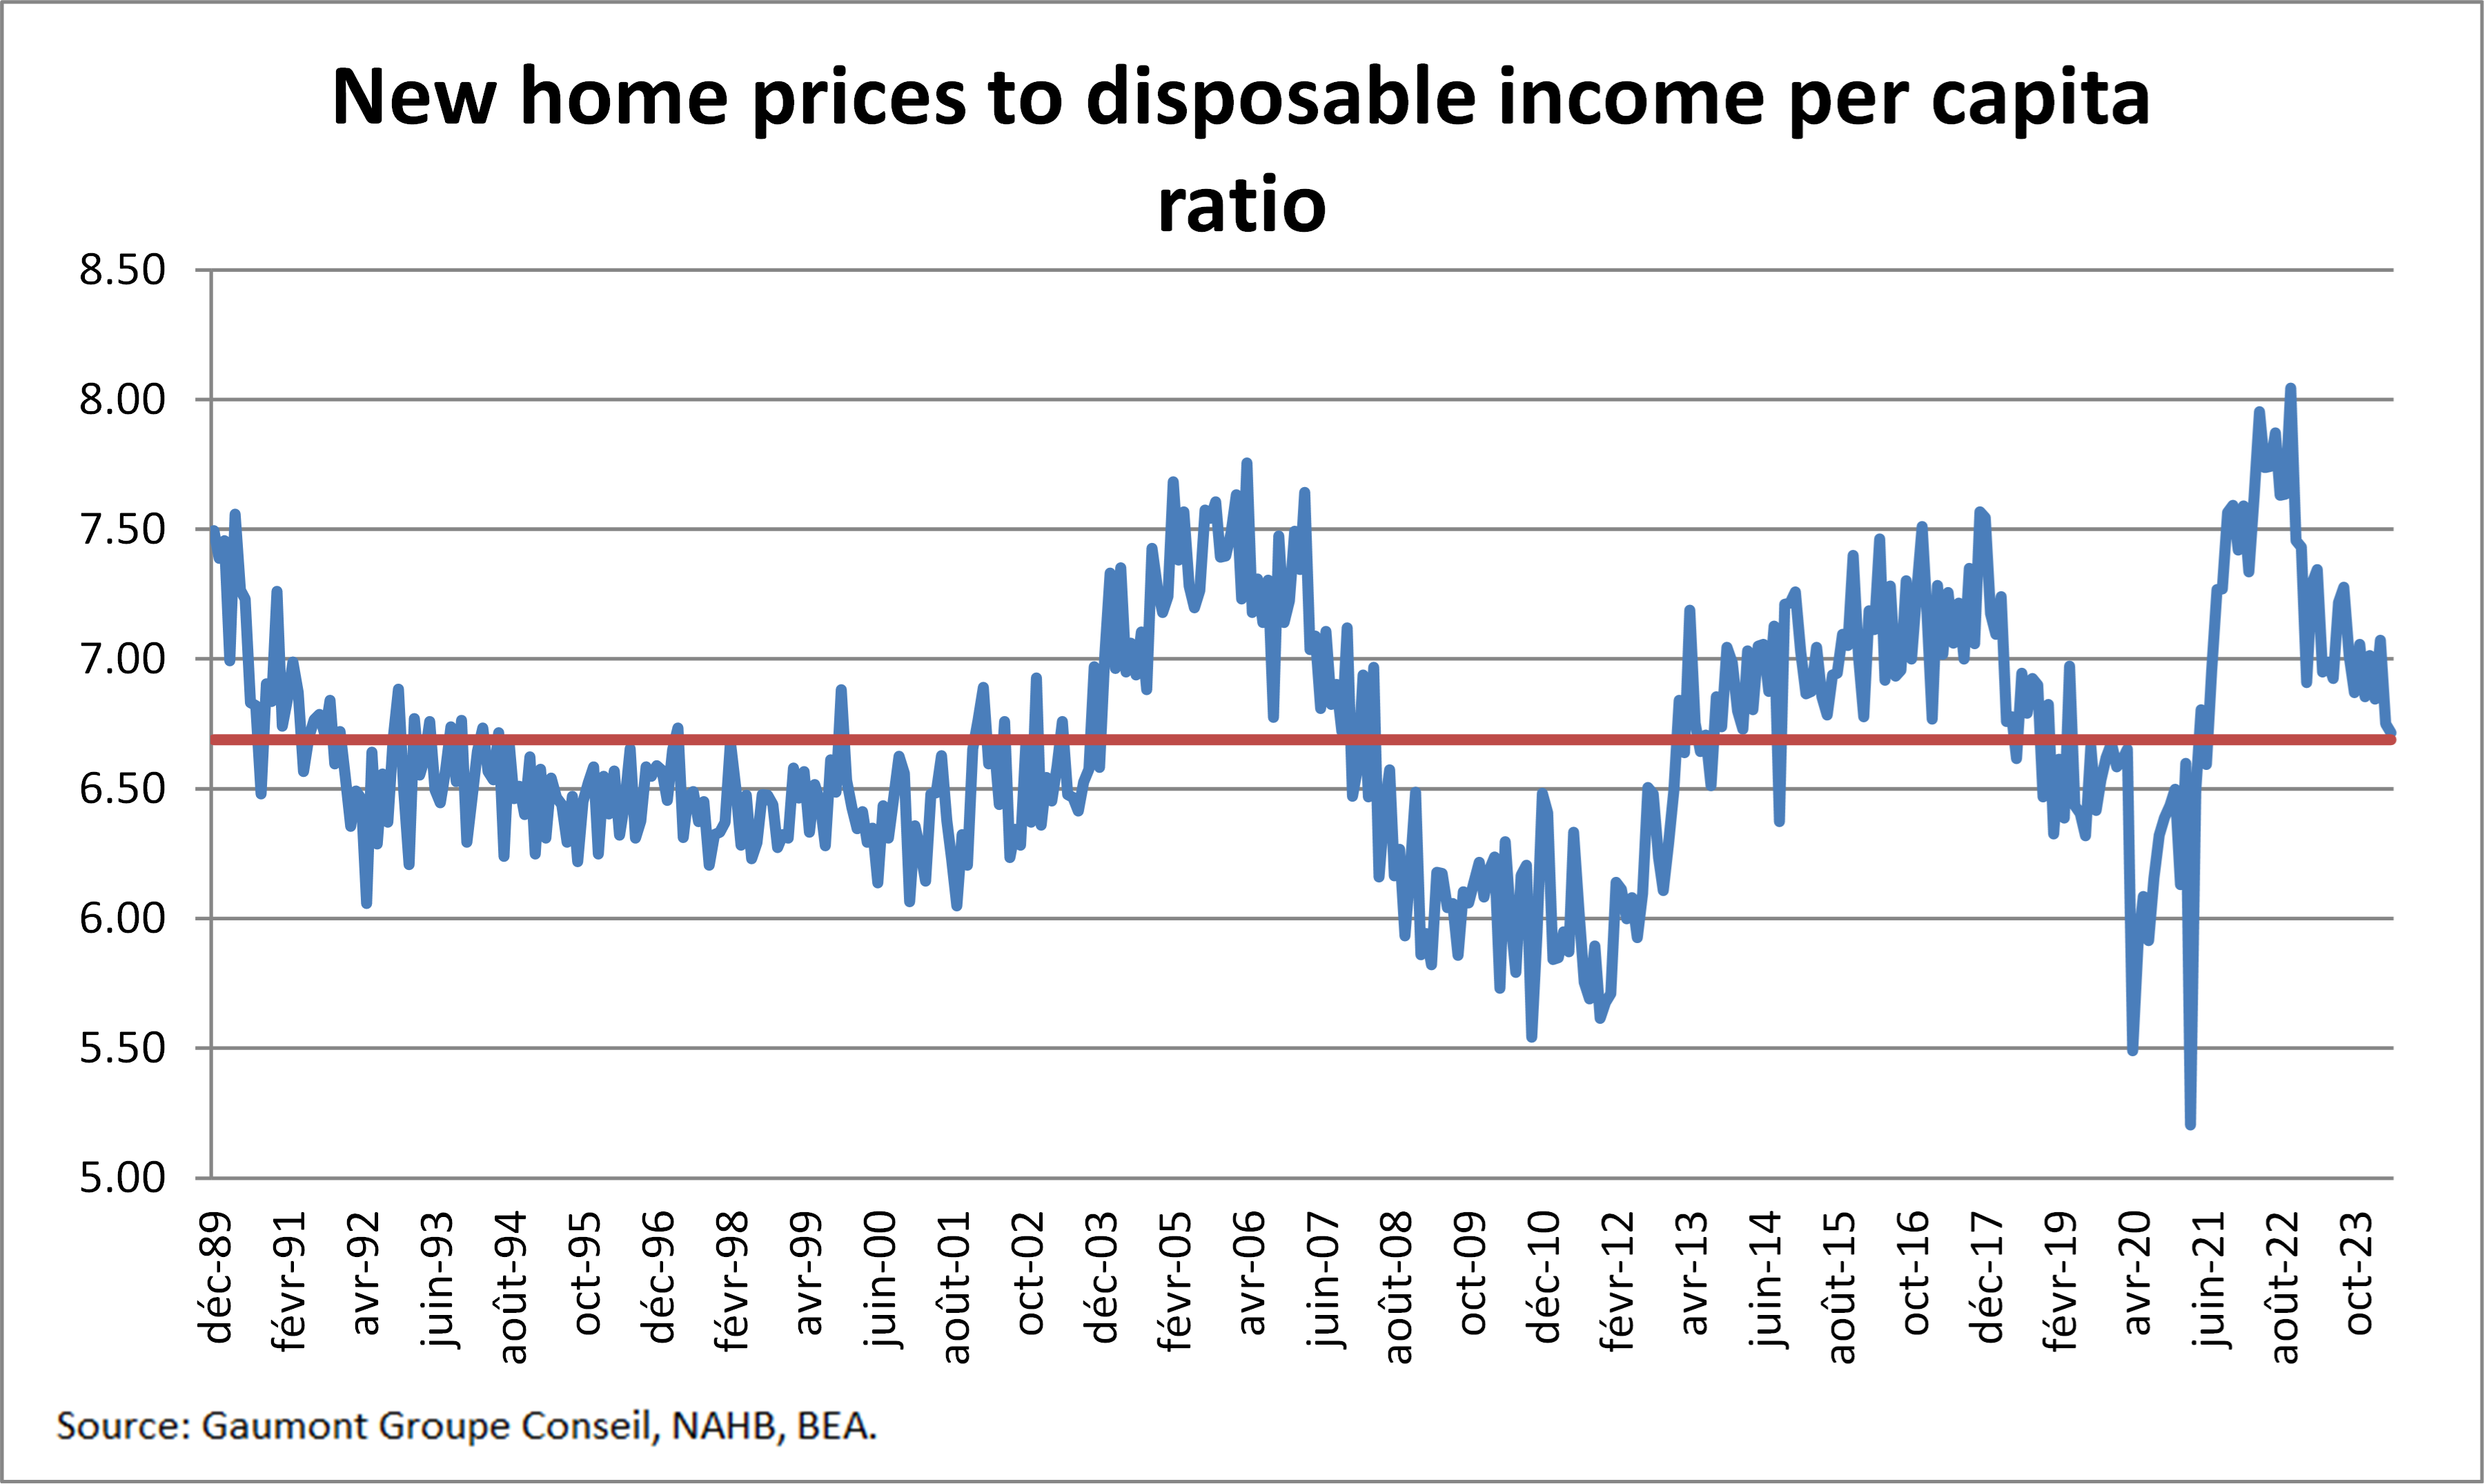
One of the segments that reacts most quickly to rate increases is naturally that of real estate. And new homes respond more quickly than existing homes. Contractors adjust their prices so as not to be stuck with unsold houses.
The good news in the new home sector is that their prices have returned to balance. In the long term, house price growth is directly linked to household disposable income.
New home prices and disposable income (United States):
The less good news is in the existing homes sector.
The sales level is at its lowest in more than 20 years, as evidenced by the following graph.
Existing Home Sales to Close (United States):

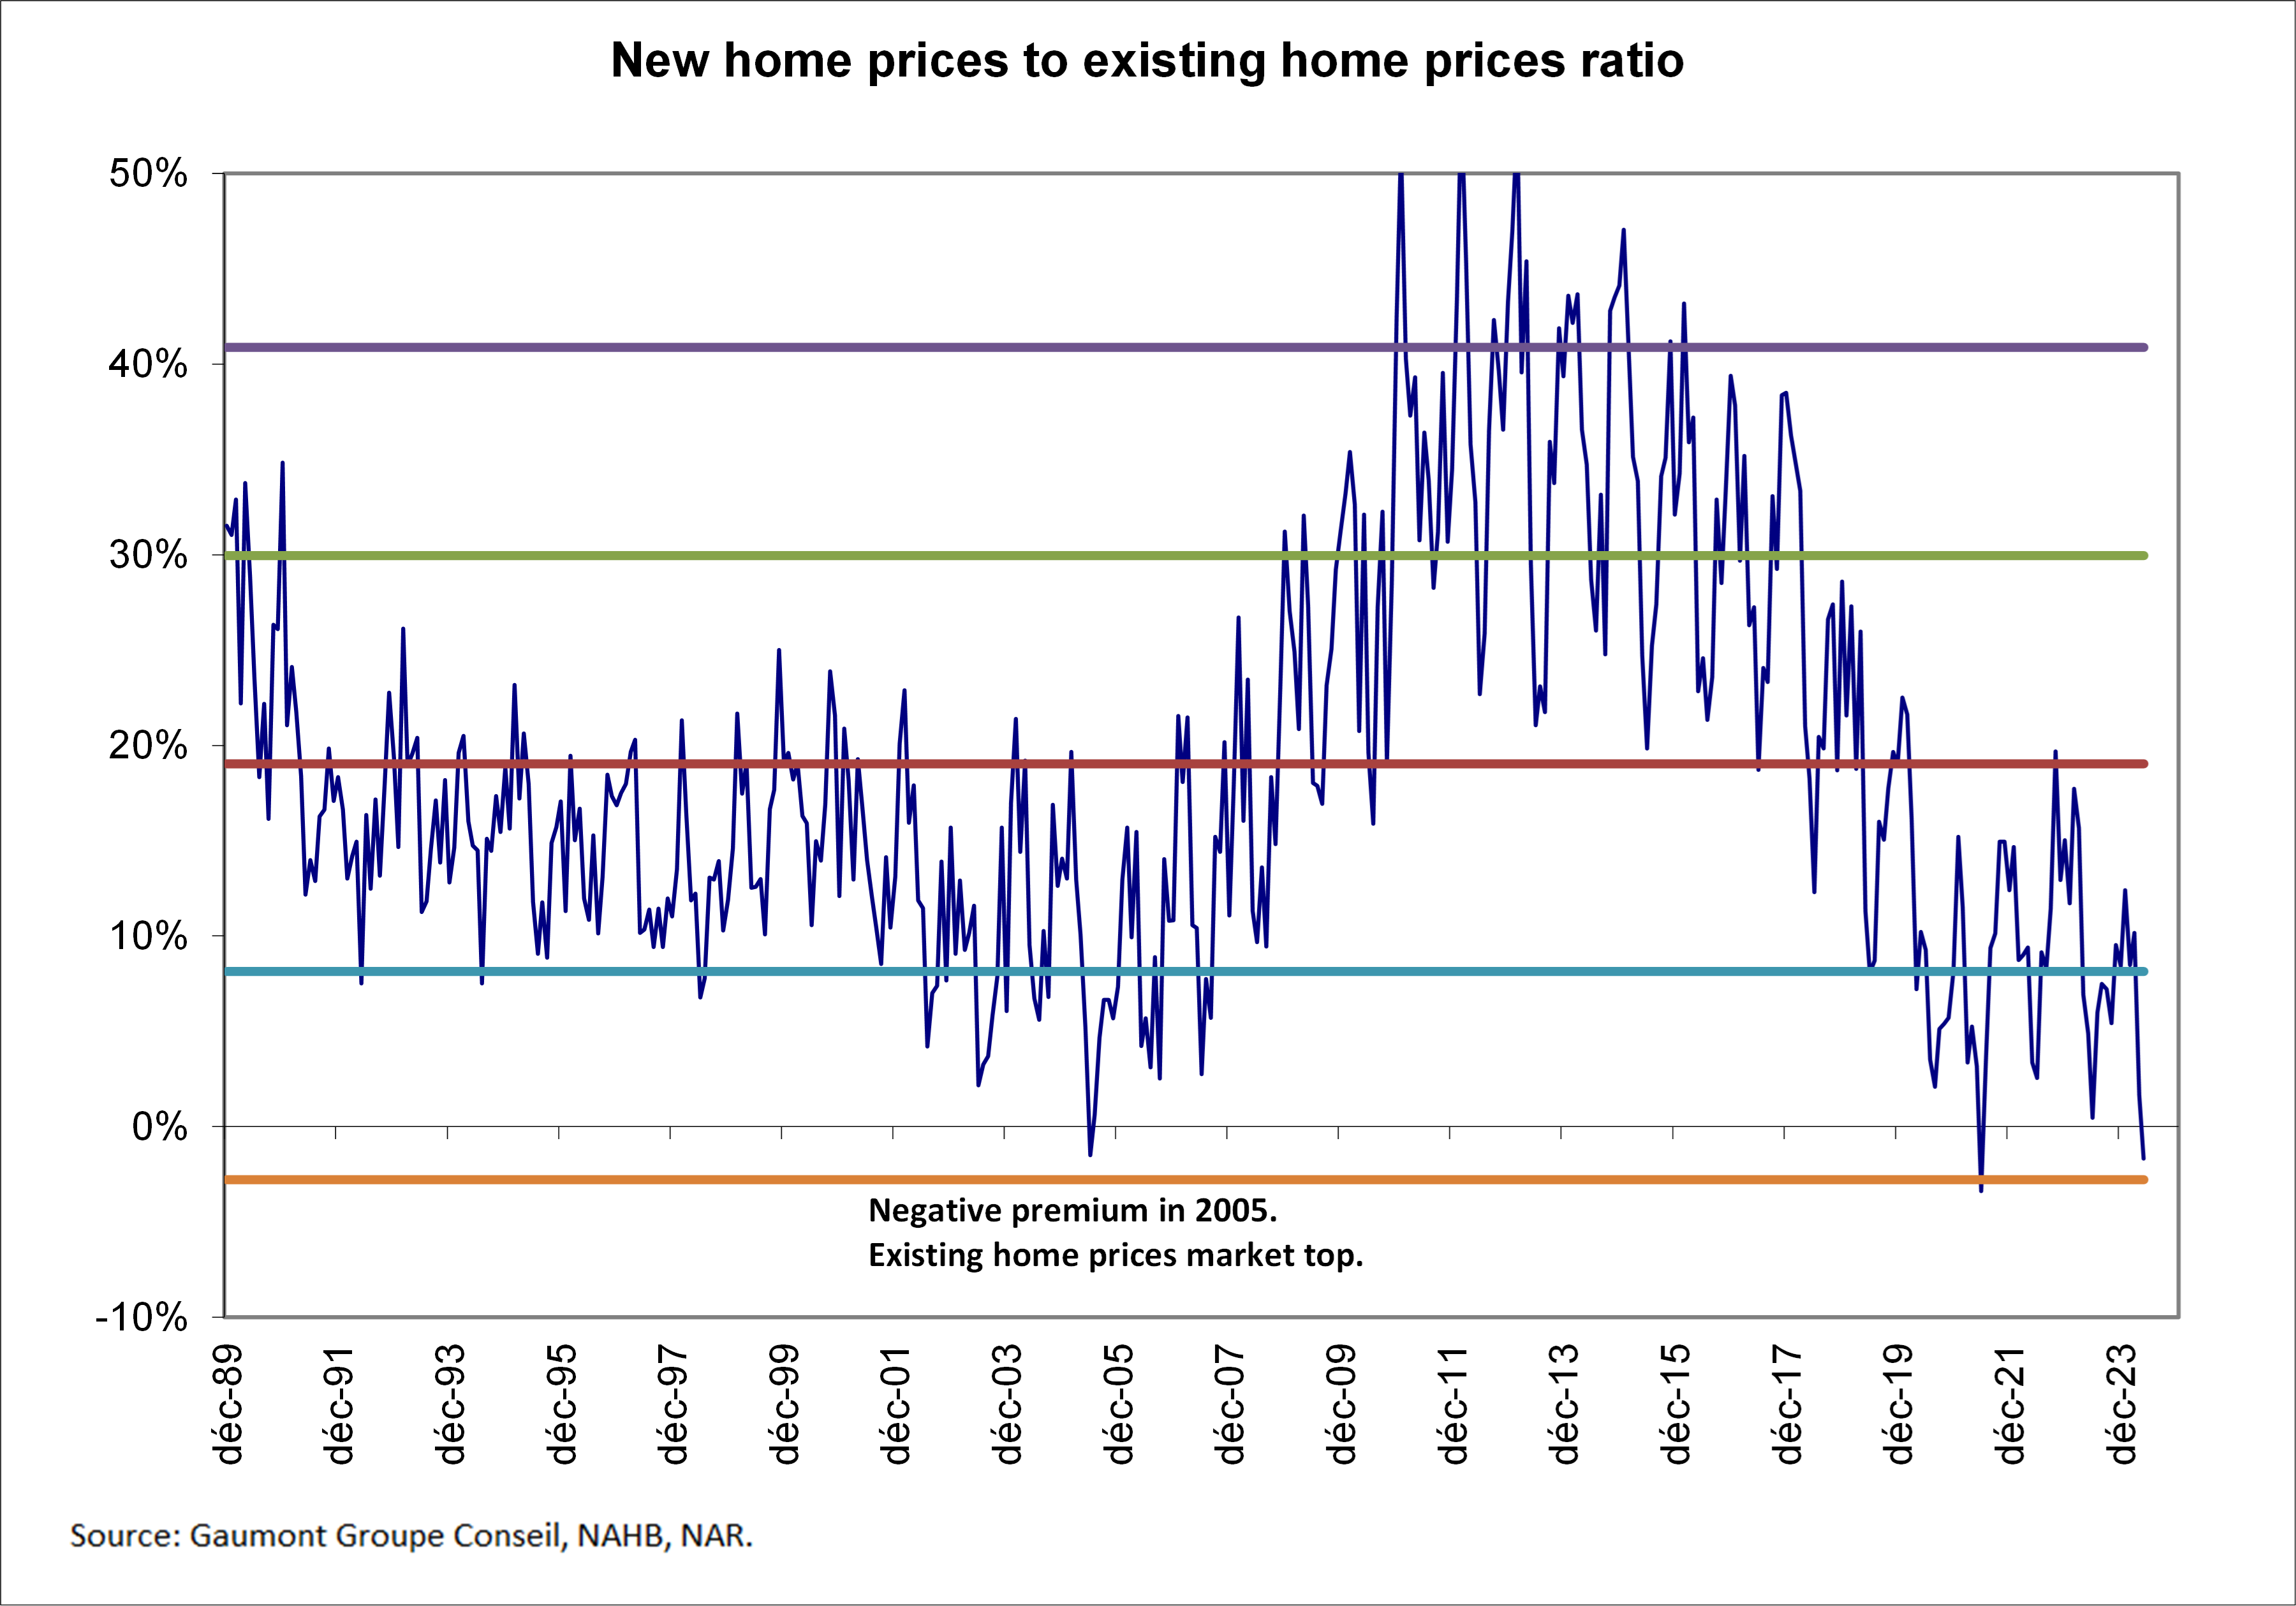
Existing homes sell for the same prices as new ones. However, they are normally 20% cheaper than new ones. On a disposable income basis, existing home prices are 17% higher than equilibrium.
Prices of new and existing homes (United States):
As evidenced by the following graph, the vast majority of residential and commercial real estate segments continue to deteriorate. This will continue to be a drag on the growth of the sector and a risk on the balance sheets of banks in the United States.
State of the various segments of the American real estate market:

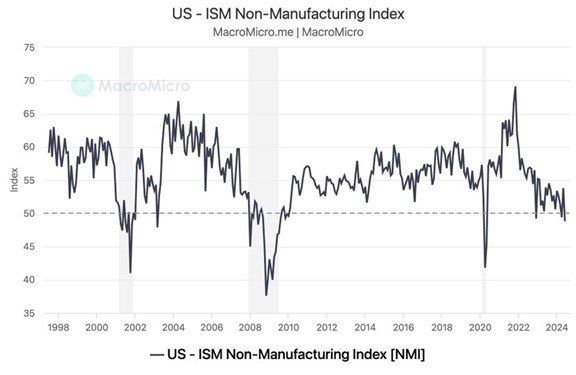
Finally, in June, the ISM Services index is now below 49, a level only reached in April 2001, January 2008 and April 2020. At these times, the American economy was in recession and the Fed cut its key rate.
ISM Index – Services: (United States)
Fixed income:
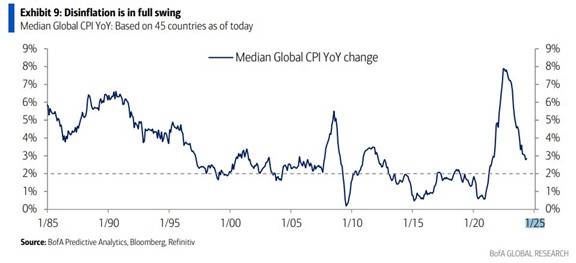
The slowdown in inflation growth is a global phenomenon, as demonstrated in the following chart. A few more quarters and we will have returned to average levels before the pandemic.
Inflation around the world:
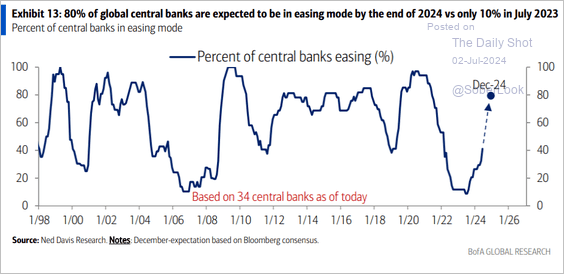
With this in mind, the current posture of central banks around the world is not surprising. In fact, 40% of banks are in easing mode and this should be close to 80% at the end of the year.
Percentage of central banks in easing mode:
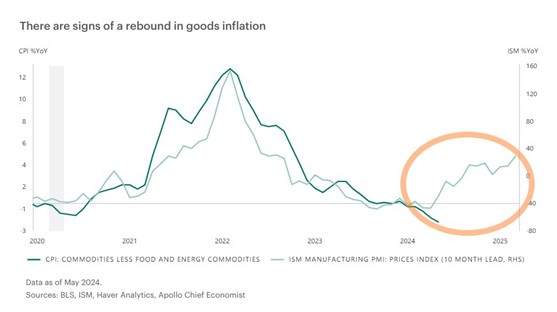
Although the underlying trend is a reduction in the inflation rate (via the housing component), the price of goods could slow down this decline slightly.
Goods inflation (United States):
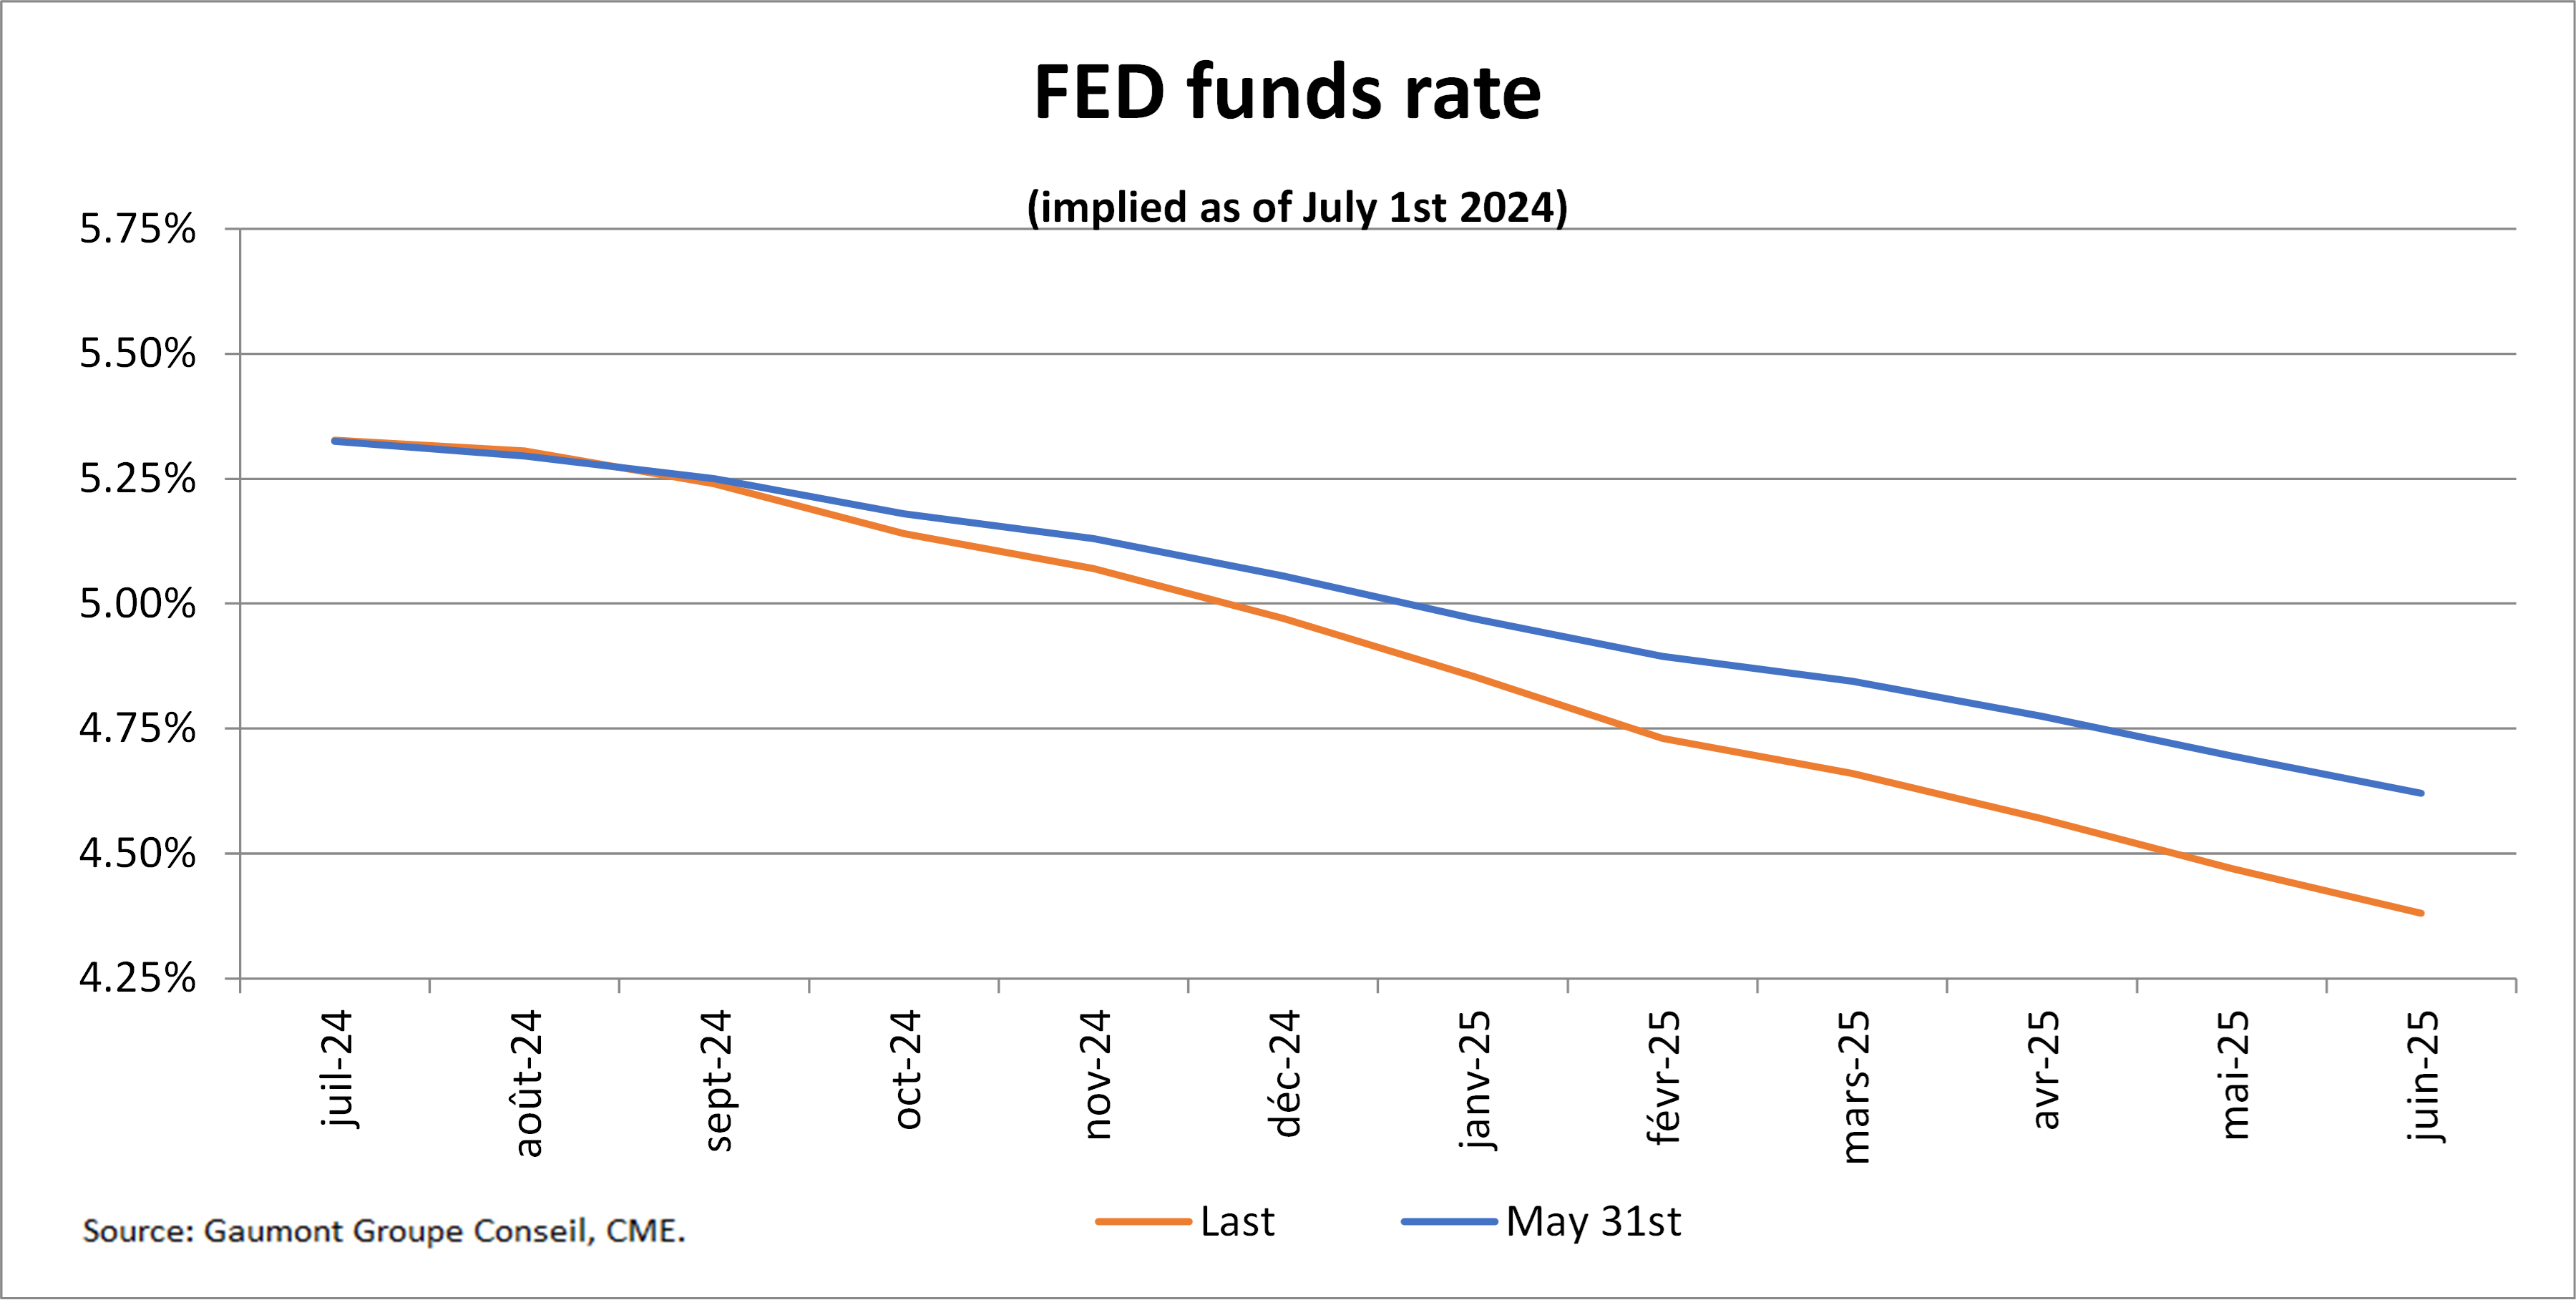
Market participants anticipate that the Fed’s key rate will be 0.36% lower at the end of December, or 4.97%.
Implied short-term interest rates (United States):
Stock markets:
The stock market frenzy continues and looks more and more like the summer of 2007. For example, nonchalance towards the real estate market in general, a restrictive monetary policy which is coming to an end, fund managers who are starting to limit outflows of funds (real estate) due to lack of liquidity and a desire not to destroy the market even more. Finally, the most serious, securities backed by real estate assets (rated AA and A by the rating agencies) which lose 100% of their value.
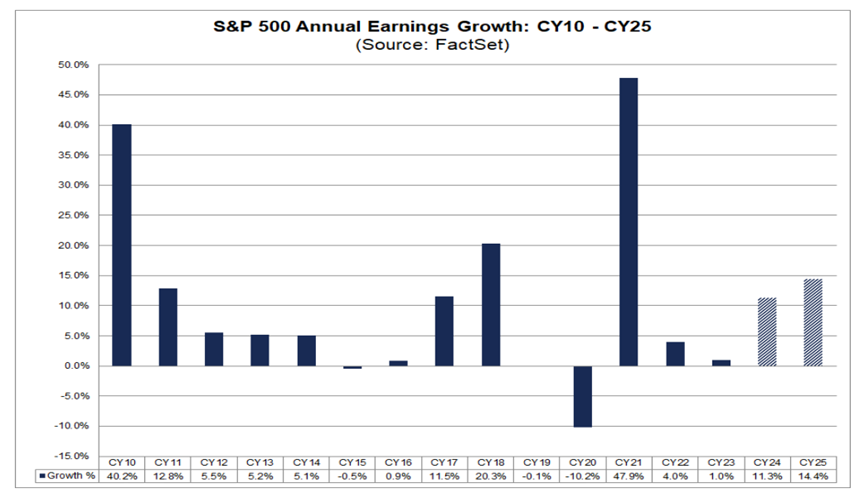
US stocks are very expensive and, what’s more, these valuations are based on extremely optimistic earnings growth.
S&P 500 earnings growth rate:
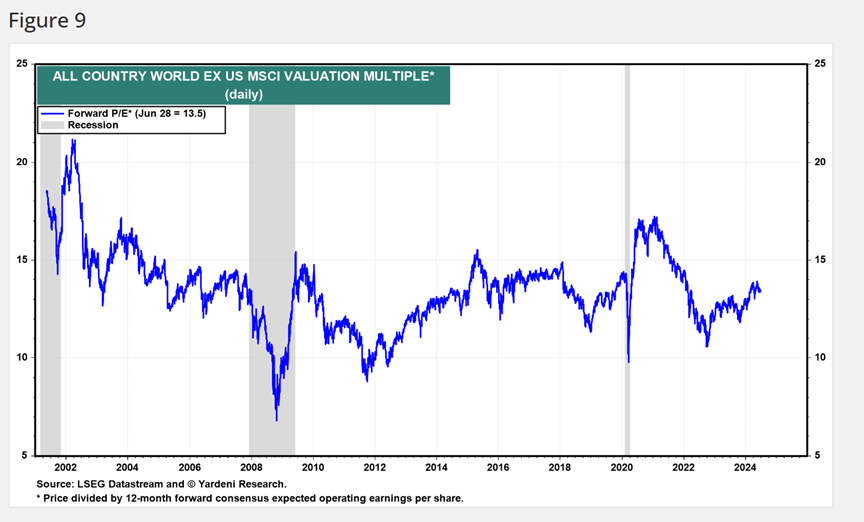
At least the titles outside the US are more in line with history. These should be less affected during corrections.
Valuation of global stocks excluding the United States:
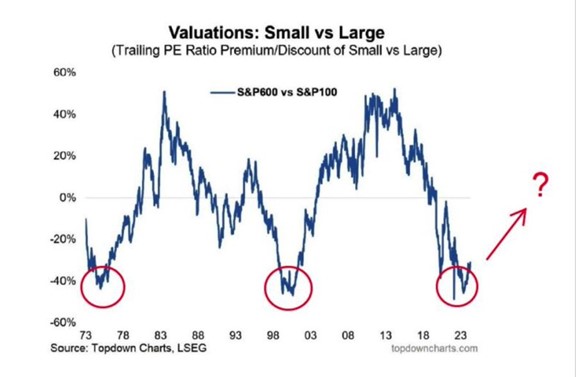
As for small caps (S&P 600 index), their valuations are significantly below their historical figures (vs. large caps). There are certainly bargains to be found in this world, but while remaining in quality.
Valuation gap between large caps (S&P 100) and small caps (S&P 600):
Finally, stock market returns remain strongly correlated with liquidity (bank reserves) in the financial system. However, we are currently observing a strong decoupling between the 2 series. A decrease in liquidity and strong growth on the stock market. Another red flag…
Central bank liquidity and stock market returns (World):

CONCLUSION :
Risky assets trade at high valuation levels given the risks. With current rates, bonds remain more attractive than stocks. As the impacts of past rate hikes dissipate (outside the US), opportunities could arise during corrections. You will need to be prepared to deploy capital into equities in a timely manner.
Frédéric Mercier CFA, SIPC
Director – Financial markets