
FINANCIAL MARKETS REVIEW
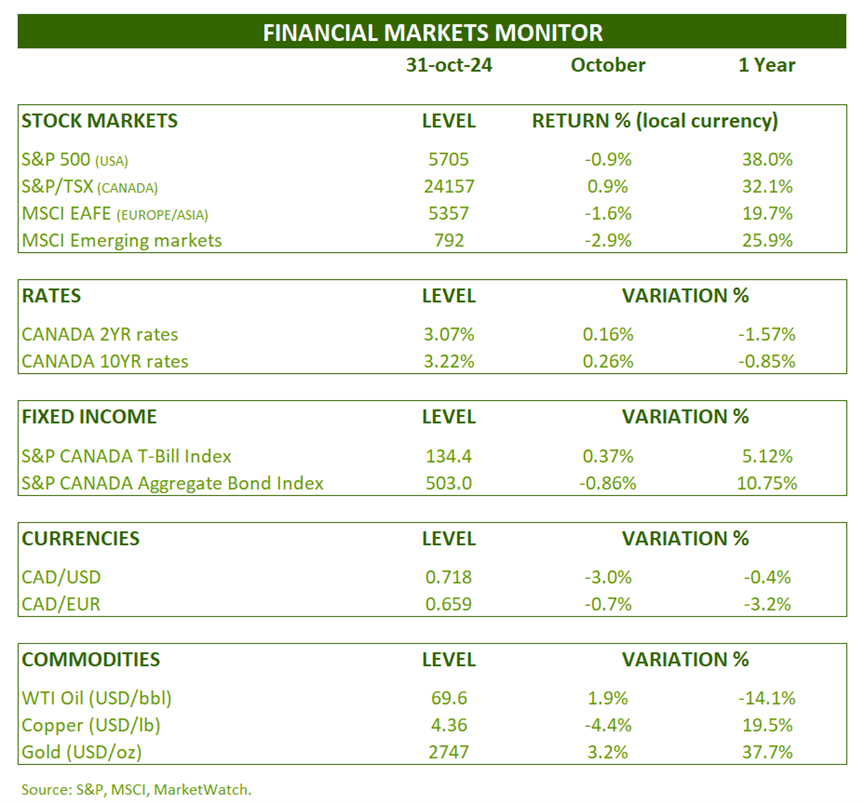
The approach of the American elections makes the stock and bond markets very nervous. With the exception of the Canadian stock market (+0.9%), the vast majority of stock markets around the world ended the month in the red.
The prospect of a Trump administration, with its tariff increases and mass deportations, raises fears of a rise in inflation.
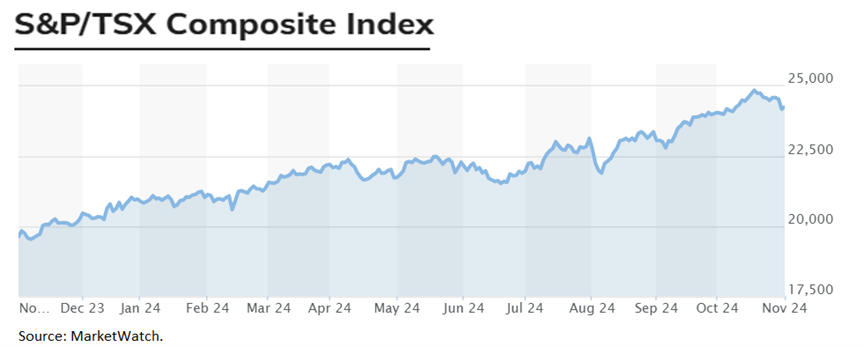
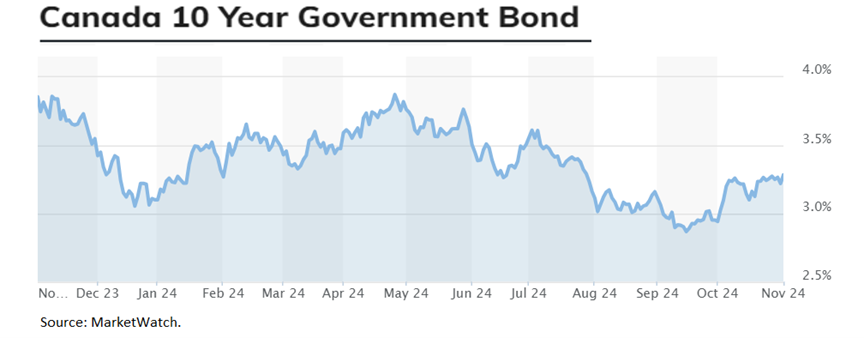
This is why bond rates rose by 0.26% in Canada and 0.50% in the United States. These sharp rate increases resulted in a negative return for the Canadian bond index, i.e. -0.86% for October.
On October 23, the Bank of Canada lowered its key rate by 0.50% to 3.75%.
OUTLOOK:
Economy:
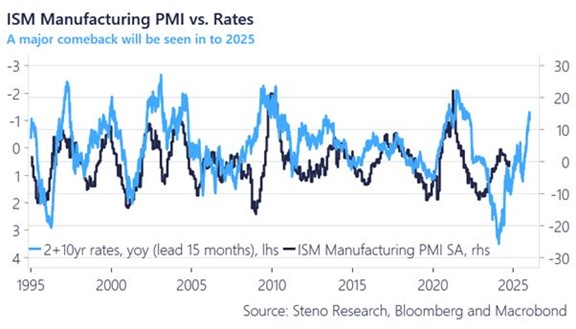
With each passing month, we see more and more that the fight against inflation is over. Indeed, in both the United States and Canada, the various inflation rates are between 1.5% and 2.5%. Central banks will continue their rate cuts in the coming quarters. This means that the tailwinds will continue at the economic level, as shown in the following graph.
Interest rate changes as leading indicators of the ISM manufacturing index
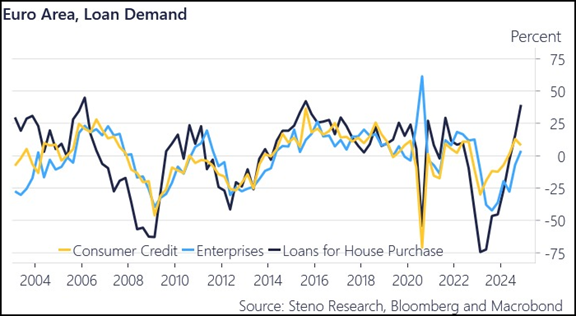
Lower rates, and lower credit conditions in general, are leading to higher demand for loans. This is happening in Canada, the US and also in Europe (next chart). We see that in Europe, demand for business loans, mortgages and consumer loans are all back to their pre-pandemic levels. This is evidence that past rate cuts are starting to pay off.
Credit Demand (Europe):
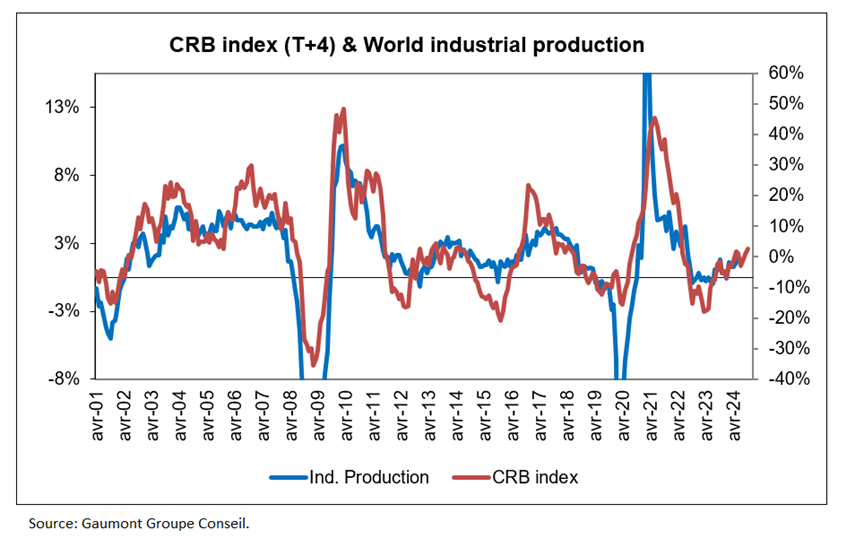
Industrial commodity prices also provide clues about future industrial production. In this regard, we see that industrial production is progressing well and that industrial production will gain strength in the coming months.
CRB Commodity Index and World Industrial Production
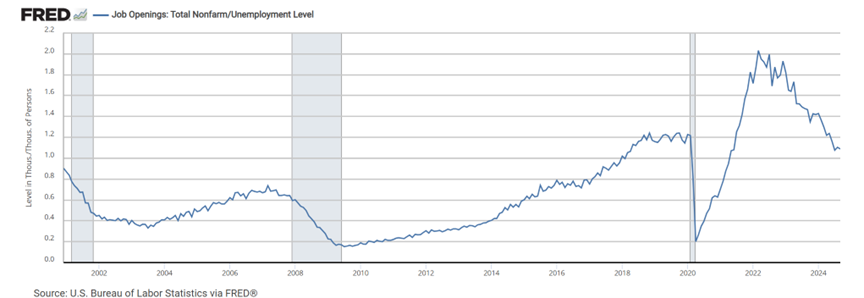
The US job market continues to create jobs, but it is still fragile. However, let us remember that employment is a lagging indicator that tells us about the past state of the economy (and not the future like leading indicators). What seems increasingly clear is that the post-pandemic imbalance is well and truly over. In the following graph, we see that the number of available jobs versus the number of unemployed people is back to the 2019 level. This excess demand for workers gave bargaining power to workers and resulted in sharp increases in wages. Wages that are growing less quickly allow the FED to continue to lower these rates.
Ratio of number of available jobs to number of unemployed people: (United States)
Fixed Income:
Let’s get back to inflation in Canada. In the left-hand chart below, we see that inflation rose by 1.6% in September and by 0.4% if we exclude housing costs. These very low figures allowed the Bank of Canada to lower its rate by 0.50% at its last meeting. In the right-hand chart, we see that real rates (Bank rate – inflation excluding mortgage costs) remain high, even though the Bank has already lowered its rates by 1.25%. The Bank will therefore continue to lower its rates in the coming months.
Inflation in Canada and real rate:

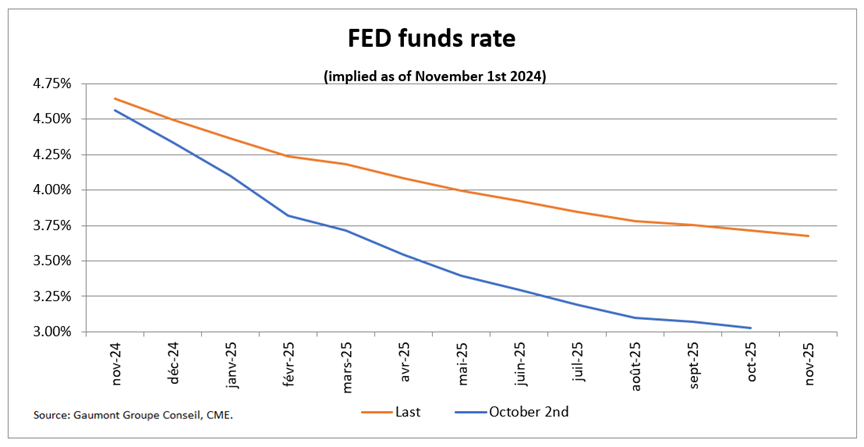
The situation is the same south of the border. The FED will continue to cut rates in order to lower real rates. Over the next 12 months, the Fed is expected to cut rates by 1.12% (market participants’ expectations)
Short-term implied interest rates (US):
The decline in short-term rates will continue to put downward pressure on longer-dated rates. In this regard, corporate bonds are now yielding 4.25% (for an average maturity of 8 years).
Canadian High-Quality Corporate Bond Index Interest Rates

Stock Markets:
The savvy stock market investor knows that there are 2 types of bombs that he must avoid (or mitigate) in his portfolio:
• Suffering the repercussions of a recession. Generally, corporate profits fall by an average of 25% during these periods.
• Paying too much for the growth prospects of a company or an index. For example, paying a multiple of 20 times the profits when 15 times is the appropriate multiple.
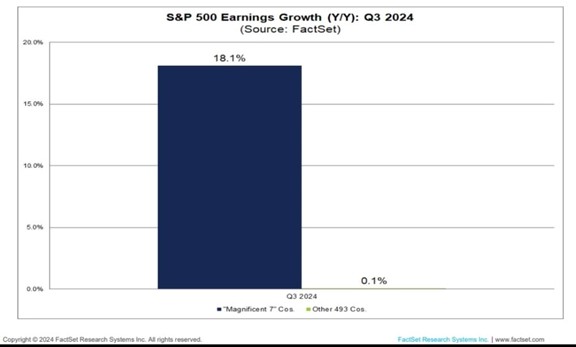
In the United States, the economic climate in recent years has been difficult for a majority of companies, growth has come mainly from the Magnificient Seven (Mag7). For example, in the 3rd quarter of this year, the growth in profits of the S&P 493 is 0.1%, while the Mag7 is 18.1%. Elsewhere in the world, profit growth has also been very weak. With rates falling for a while, it’s unlikely that earnings will collapse anytime soon.
S&P 500 Earnings Growth in Q3 2024:
Now, let’s look at the multiples we pay in the various markets.
In the US, the ratio paid is much higher than historical, partly due to the higher growth of technology companies. However, history tells us that the higher the ratio paid, the lower the future return will be.
S&P 500 valuation and subsequent 10-year return (US):

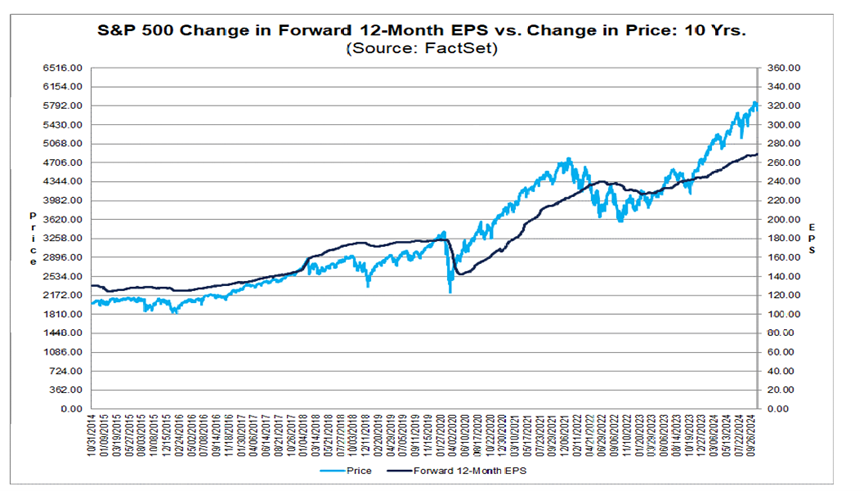
Another way to analyze the situation is to observe the evolution of profits and the level of the index. In the long term, the 2 series converge, but we can see that the gap has widened over the past year.
Level and profits of the S&P 500 (United States):
European/Asian and emerging market stocks are trading at multiples very close to their historical averages.
Evolution of the price/earnings ratio of various markets:

CONCLUSION :
The recent rise in 10-year interest rates makes bonds more attractive than in the 3rd quarter. It is easy to create a high-quality portfolio offering a rate of 4.5%. In parallel with the improvement in the economic backdrop, the attractiveness of equities (excluding Mag7) is increasing. Holding quality securities with a reasonable valuation is still preferred.
Frédéric Mercier CFA, SIPC
Director – Financial markets