
FINANCIAL MARKETS REVIEW
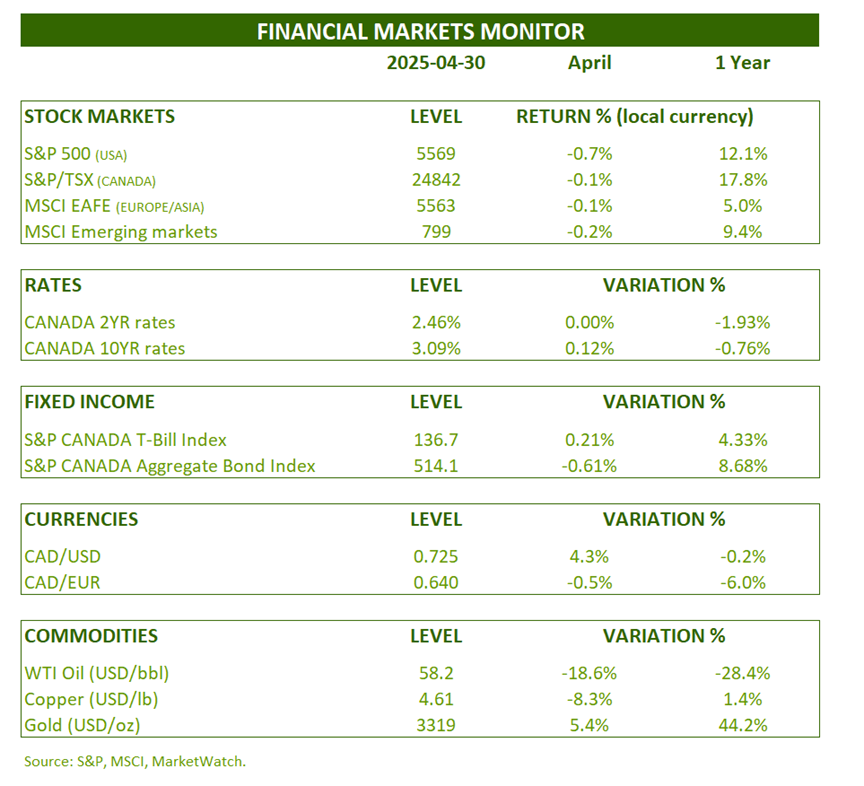
Looking at the month’s performance, one might be tempted to believe that we’ve just witnessed a quiet month. Nothing could be further from the observed reality. April 2nd was proclaimed Liberation Day by Donald Trump. Stock market chaos ensued. At its lowest point of the month, the S&P 500 lost nearly 14%, ending at -0.7%. Oil fell more than 18% and copper by -8.3%. In this context of extreme uncertainty, gold continues to perform well, with a gain of 5.4%.

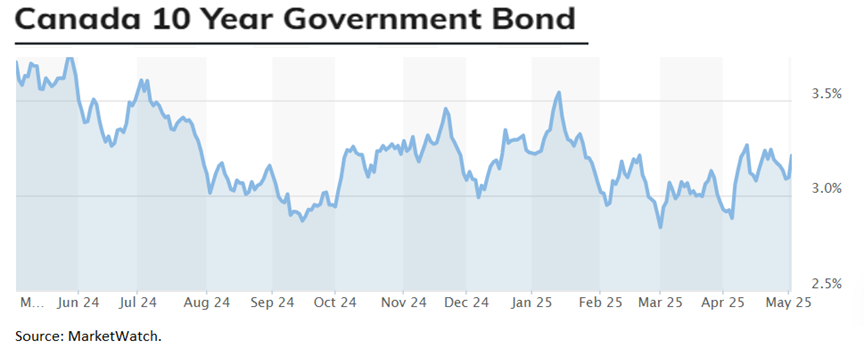
Volatility also gripped the fixed-income market. In the space of 10 days, the US government’s 10-year yield fell by 0.50%, before recovering by 0.60%. In Canada, the yield rose by 0.12%, resulting in a performance of -0.61% for the Canadian bond index.
OUTLOOK:
Economy:
Financial markets and central banks are having great difficulty (and rightly so) assessing the impacts of this tariff war. This is why volatility is so high.
Let’s try to get a handle on this.
Let’s not forget that the impact of current events will take place in one to three quarters.
In other words, the current state of the economy reflects what happened six months ago.
The rate cuts we saw in 2024 and early 2025 have a positive effect on economic activity, but with some volatility.
Changes in 10-year interest rates and ISM Manufacturing (Q+14) (United States):

Initially, Trump’s election instilled an impressive level of optimism in the business community. It was a good time to invest in their companies, inflation was under control, and the Fed was gradually lowering rates.
The U-shaped shift in business activity was impressive in March and April. The following chart is very informative.
At the beginning of the year, new orders were surging, but inventories were not. Manufacturing production was therefore stimulated. Inventories subsequently exploded, but new orders fell drastically. The ISM Manufacturing Index will continue to be under pressure in the near future.
New Goods Orders (in excess of inventories) and ISM Manufacturing (United States):

The consensus among economists now predicts a decline in GDP growth and a rise in inflation for 2025. This is one of the worst possible economic scenarios. The Fed finds itself in a very difficult position, in addition to the President’s continued criticism. Normally, the Fed will raise rates if excess demand pushes up prices. In the case of a supply shock (tax increase), monetary policy has no impact. Moreover, unless tariffs continue to rise, the effect on prices should be one-off.
Consensus GDP growth and core inflation for 2025 (United States):

The good news is that Trump can reverse his tariff war whenever he sees fit. It’s a shock to the economy, but he has it under control. This isn’t a natural disaster that can’t be helped. It would be surprising if it lasted long. Trump has already begun to back down.
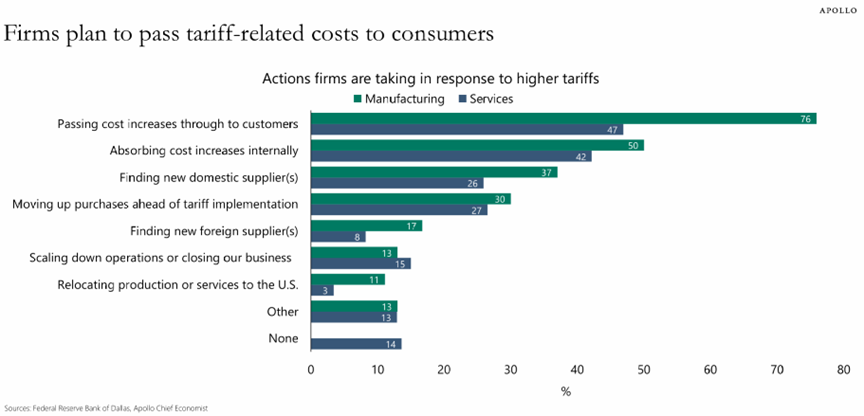
A recent survey by the Federal Reserve Bank of Dallas provides insight into the strategies of American companies regarding the tariffs:
• 76% will pass the bill on to consumers
• Only 11% will bring production back to the United States.
Action plan of American companies in the tariff war. Survey by the Federal Reserve Bank of Dallas:
The probability of a recession is increasing daily.
Probability of a recession in the United States in 2025:

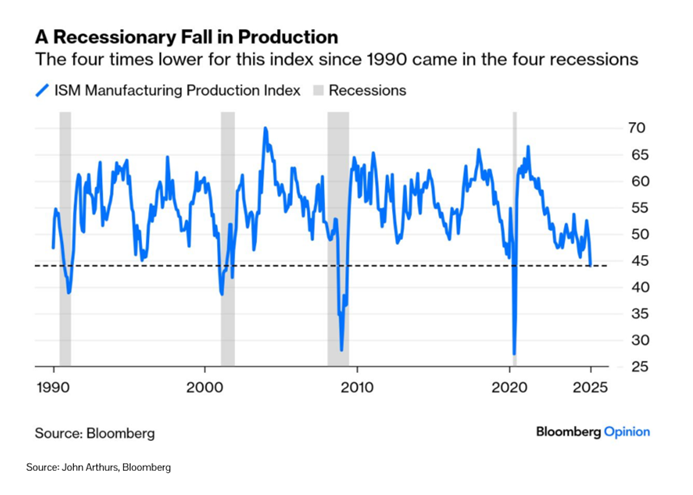
During the last update of the ISM indices in May, the production sub-index reached 44. However, since 1990, a reading below 45 has always been associated with a recession.
As we mentioned in the last markets review, everyone loses in a tariff war. Companies surveyed by the ISM do not seem to see any benefits on the ground; quite the contrary.
ISM Manufacturing Production Index and Recession (United States):
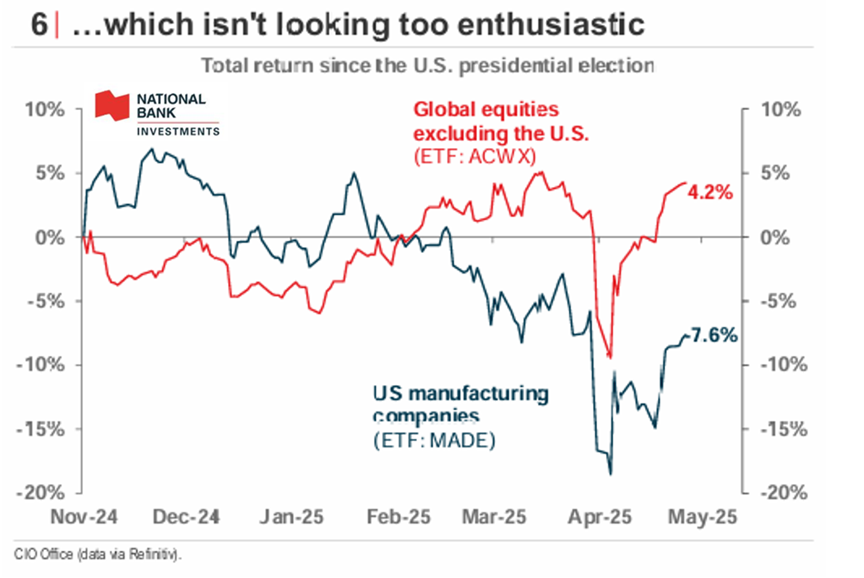
Manufacturing companies are also not seeing any profits on the stock market. As the following chart shows, their companies are significantly underperforming global stocks outside the US. The performance gap is nearly 12%.
Stock market performance of US manufacturing companies and global stocks outside the US:
Fixed Income:
In the short term, tariffs can only have a negative impact on US inflation. Moreover, the weak US dollar makes imports more expensive. Nearly all leading indicators point to a price increase. Nothing on the scale of 2021 and 2022, but still an increase of 3 to 3.5%.
Regional manufacturing surveys, Prices Paid Index (United States):

However, wage pressures remain contained. The good news is that the services producer price index (a leading indicator of services inflation) continues to decline and has reached 2.3% (annualized) over the past six months. We are back to the level prevailing before the pandemic.
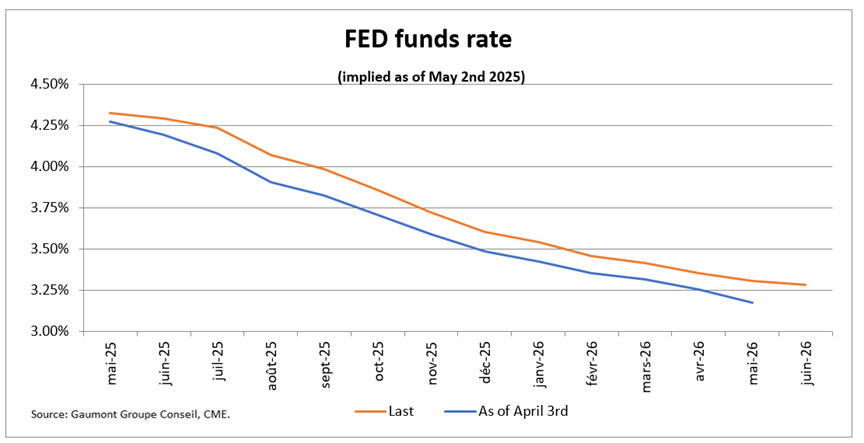
Expectations of Fed rate cuts have changed little over the past month. A 0.72% cut in the federal funds rate is currently forecast by market participants in 2025.
Implied short-term interest rates (United States):
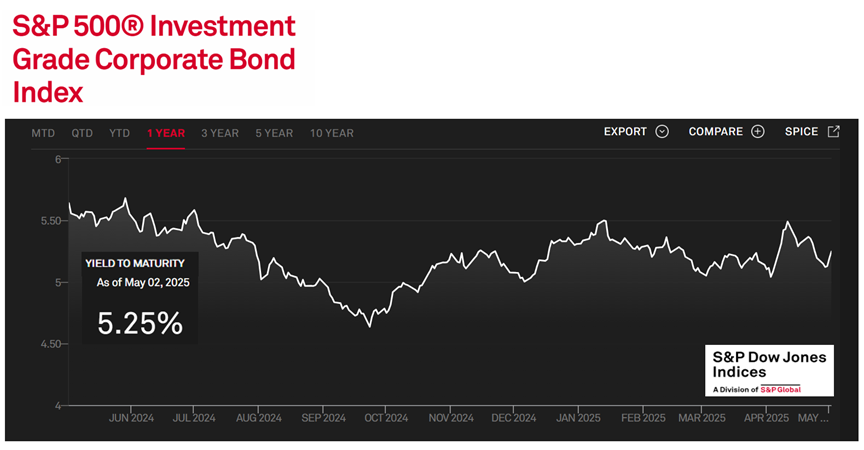
The current level of uncertainty is making investors more nervous. As a result, corporate credit risk premiums remain high. Currently, a diversified portfolio of large, high-quality US companies (with maturities of approximately 7.5 years) generates an annual yield of 5.25%. This is attractive for investors.
Interest rates on high-quality US corporate bonds:
Stock Markets:
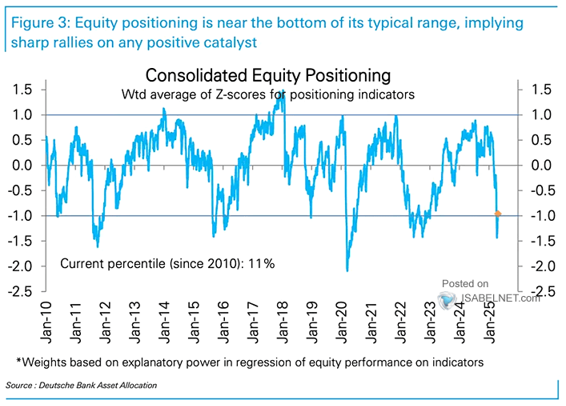
The stock market was bloody in April, to say the least. The stock market panic allowed disciplined investors to go bargain hunting in April. Regardless of the quality of the stocks, all were swept away by the Trump storm. This is the best time to acquire high-quality stocks at low prices. A high level of pessimism remains, but it is gradually dissipating as the markets rise.
Global investor positioning (United States):
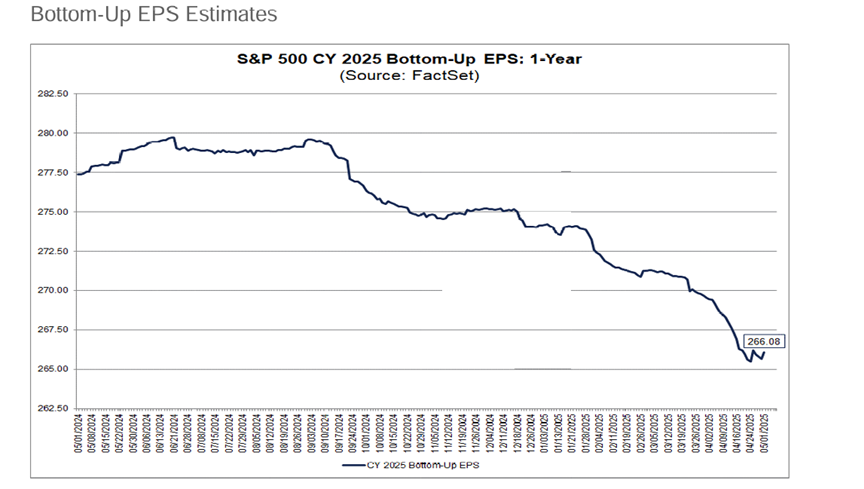
Earnings forecasts for 2025 have been revised downward, but they appear to be stabilizing. The annual growth forecast was very optimistic.
S&P 500 earnings forecasts for 2025:
Earnings forecasts were optimistic, but not as optimistic as stock prices in the United States. Broadly speaking, the growth of an index parallels the growth of its earnings. In the following graph, we see that for the past two years, there has been a notable divergence between stock prices and earnings forecasts. The two curves have recently become quite similar again.
Earnings forecasts for the next 12 months and the S&P 500 index (United States):

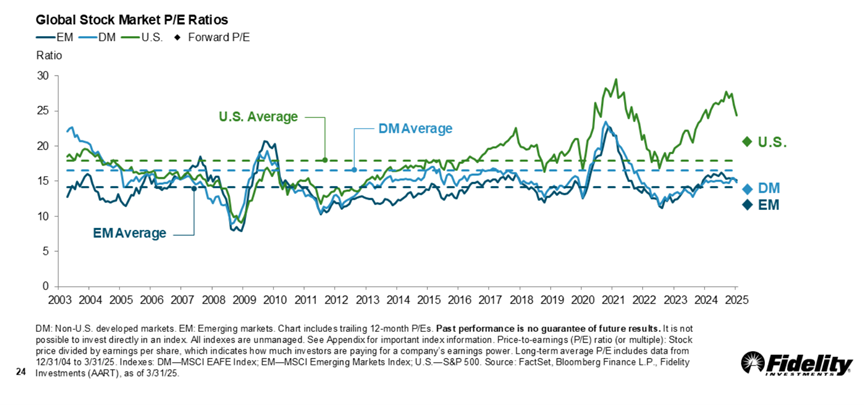
Valuation ratios (ratio to earnings over the next 12 months) have declined sharply in the United States, but remain above the 20-year average. In Europe, Asia, and emerging markets, we are below the historical average.
Price-to-Earnings (PE) ratios of various stock markets:
CONCLUSION :
We remain on the lookout for buying opportunities that arise during times of panic. It is important to maintain well-diversified portfolios, both geographically and with fixed-income securities.
Frédéric Mercier CFA, SIPC
Director – Financial markets