

FINANCIAL MARKETS REVIEW
True to his recent habit, Donald Trump continued to inject stock market volatility in May. This time, the returns were particularly strong. The US stock market generated a return of 6.3%, while the S&P/TSX index rose 5.6%. The US government’s decisions related to global tariffs are virtually impossible to track. However, savvy investors have found a way to profit from them with the TACO (Trump Always Chickens Out) strategy.
Investors buy when Trump pushes the market down (by announcing tariffs) and sell when markets rebound, as he delays or abandons tariffs.
International and emerging market stock markets also posted positive performances, with a gain of 4.7% in Europe/Asia and 3.1% for emerging markets.

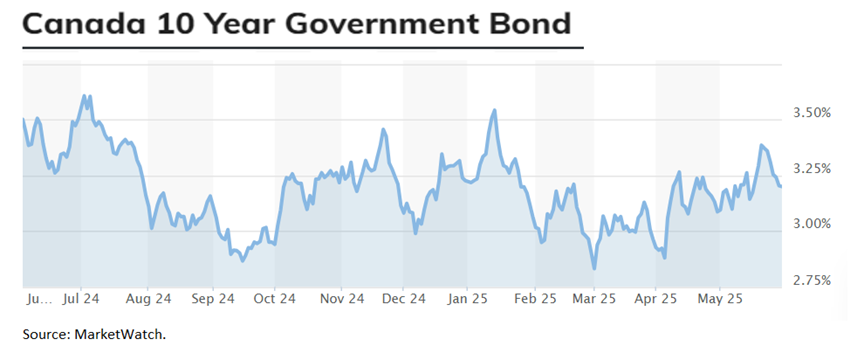
Interest rates were under pressure during the month, with the downgrade of US debt and the explosion of rates in Japan. Canadian government 10-year yields rose 0.11% in May. The Canadian bond index’s performance was 0.04%, saved by corporate bonds (+0.58%).
OUTLOOK:
Economy:
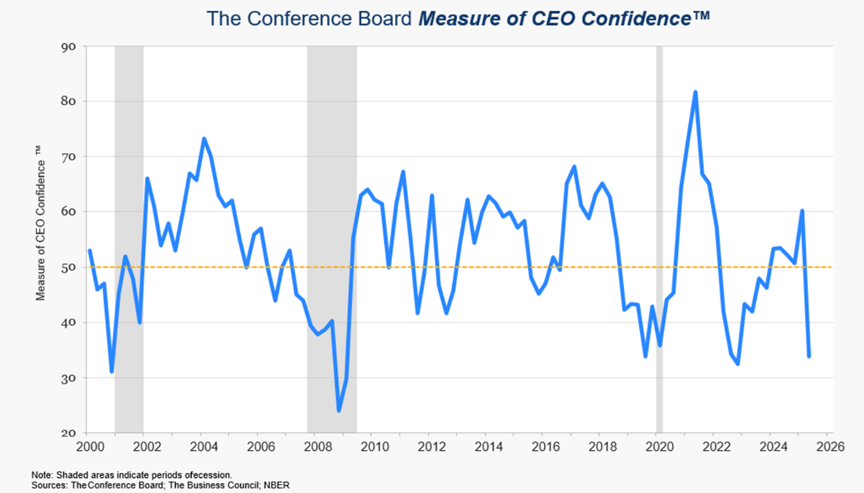
In its latest CEO Confidence Survey in mid-May, the Conference Board reported a collapse in its confidence index. We’re back at pandemic levels.
This doesn’t bode well for the future. Trump is sabotaging his own economy. 83% of respondents anticipate a recession within 12 to 18 months. With such a gloomy outlook, it’s not surprising to see them deciding to cut capital investment and slow hiring.
CEO Confidence Survey (United States):
Historically, this survey has been a leading indicator of several economic factors, including:
– business investment (3 quarters)
– gross domestic product (3 quarters)
– corporate profits (1 quarter)
– the S&P 50 index (1 quarter)
– the ISM Manufacturing Index (3 quarters), see the following chart:
Business CEO Confidence Survey and ISM Index (United States):
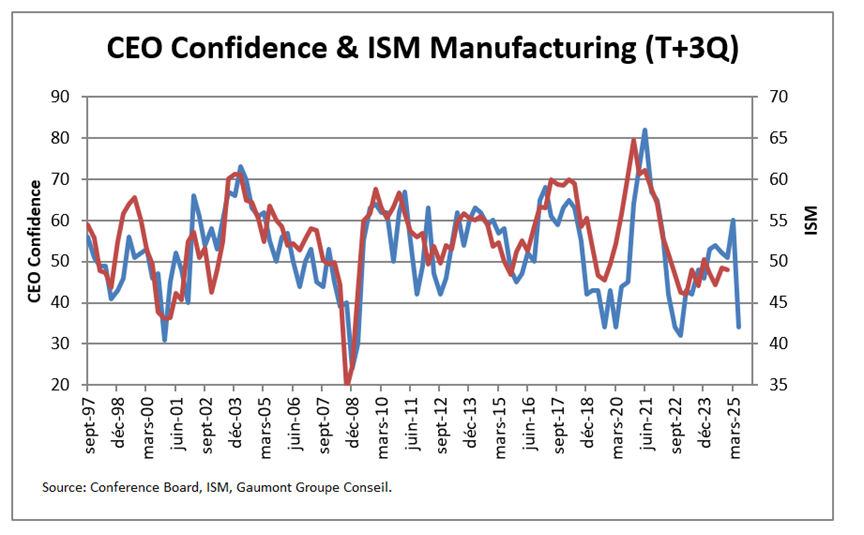
In short, so far, Trump has sowed a slowdown in the economy. He can amend his policies, but the longer he waits, the more these polling data will become reality in a few quarters.
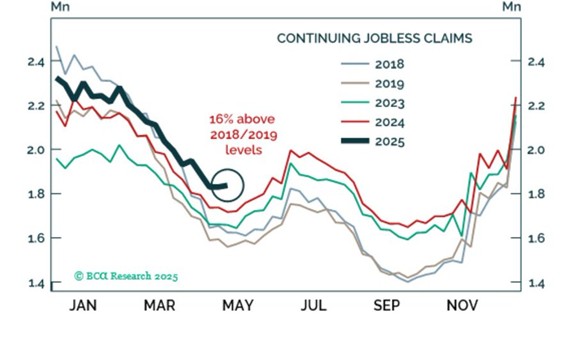
For its part, the job market is gradually deteriorating. Unemployment insurance claims are up compared to recent years, as shown in the following graph.
Total Unemployment Insurance Claims (United States):
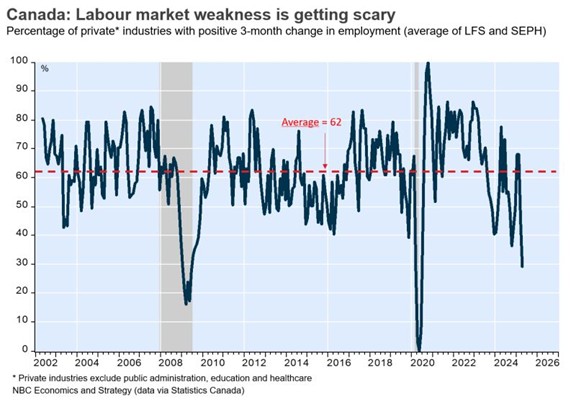
In Canada, the employment situation is even less positive. Indeed, the industries where employment is growing are at levels similar to those in 2008 and 2020, both recessionary years.
Percentage of industries where employment is growing (Canada):
Fixed Income:
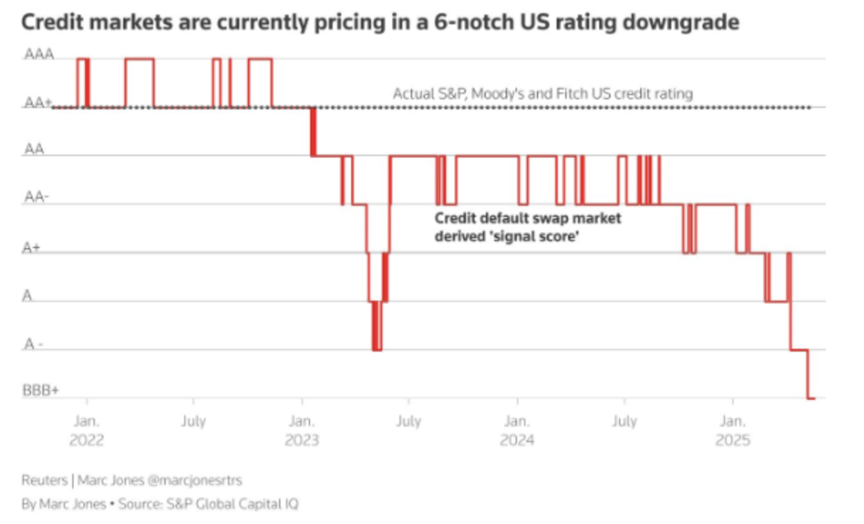
The downgrade of US debt by Moody’s has caused a lot of discussion. It’s important to note that the debt had already been downgraded in 2011 (S&P) and 2023 (Fitch), and that Moody’s was behind schedule. What’s important to note is that US debt was already trading below Moody’s new rating (AA+).
Implied credit rating of the United States:
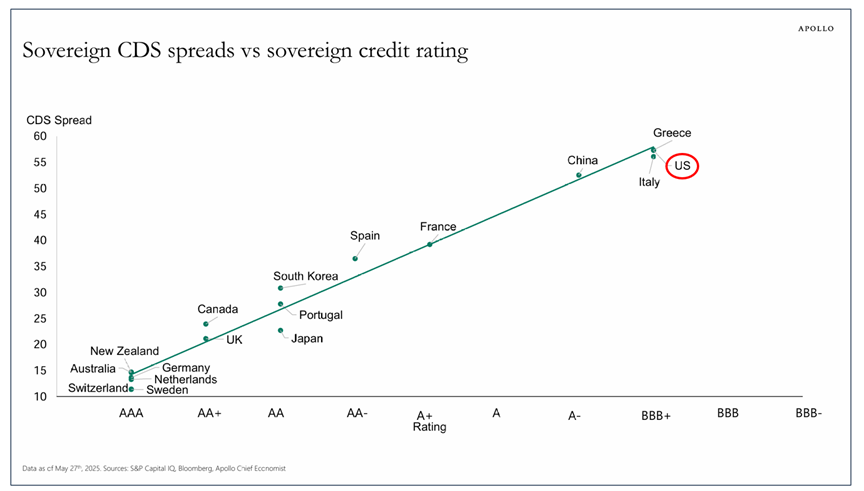
As we speak, US debt is trading at rates similar to those of Greece and Italy, i.e., BBB+. This is likely an overreaction in the short term, but the United States has a debt problem, and Trump’s unpredictability may scare off some investors.
Credit default swaps and credit ratings of various countries:
Inflation figures continue to trend in the right direction, for both goods and services. The Fed’s most closely watched inflation index is the consumer goods inflation index (PCE). The core PCE index rose 2.5% in April compared to 2024. Meanwhile, the total PCE index rose only 2.1%.
Consumer goods inflation (PCE) (United States):

This gives the Fed more leverage to lower its key interest rate.
Expectations of Fed rate cuts plummeted in May. Market participants currently forecast a 0.48% cut in the federal funds rate in 2025 and a 0.84% cut in the next 12 months.
Implied short-term interest rates (United States):

Stock Markets:
Bargain hunters drove the markets higher in May.
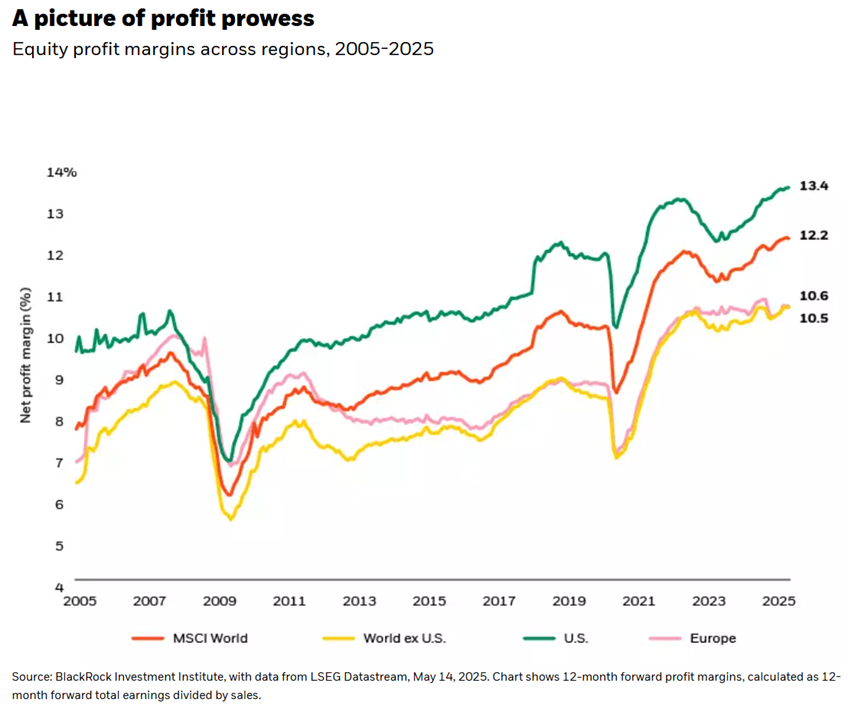
The good news is that corporate profits continue to grow despite the uncertainty. Profit margins are even reaching record highs around the world.
Profit margins across regions:
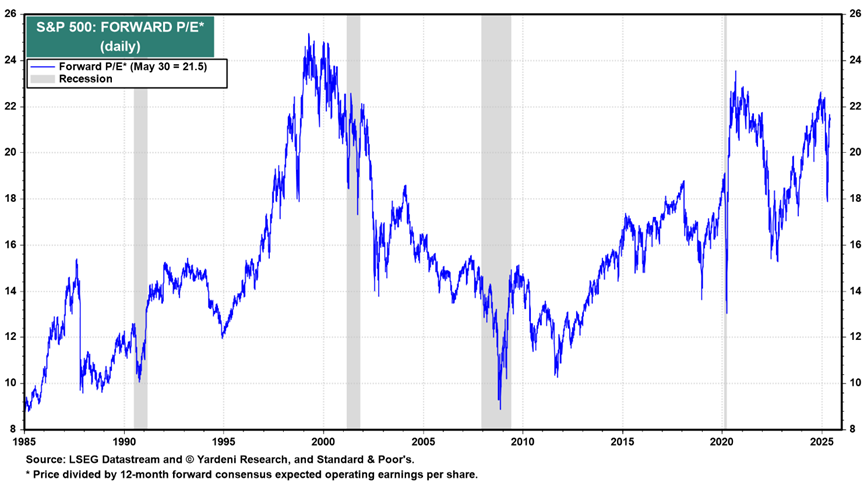
The less good news is that the S&P 500 Index is back at its pre-April panic valuation. It has fallen from 22 to 18, and back to 21.
S&P 500 Price-to-Earnings Ratio:
Euphoria has returned after the panic of Liberation Day.
Euphoria and Panic Indicator (United States):

Although they have increased, valuations in Europe-Asia remain reasonable.
EAFE (Europe-Asia) Index Price-to-Earnings Ratio

CONCLUSION :
The past two months have been perfect for opportunistic equity investors. Bargains are becoming scarcer, and interest rates are more attractive. We remain on the lookout for buying opportunities that arise in times of panic. It’s important to keep portfolios well diversified, both geographically and with fixed-income assets.
Frédéric Mercier CFA, SIPC
Director – Financial markets