

FINANCIAL MARKETS REVIEW
Global stock markets continue their momentum. In Canada, performance was a remarkable 5%. Over the past 12 months, the TSX index’s performance is close to 26%. South of the border, the S&P 500 index is up 2%. European and Asian markets are also performing well, with gains of 2.1%.

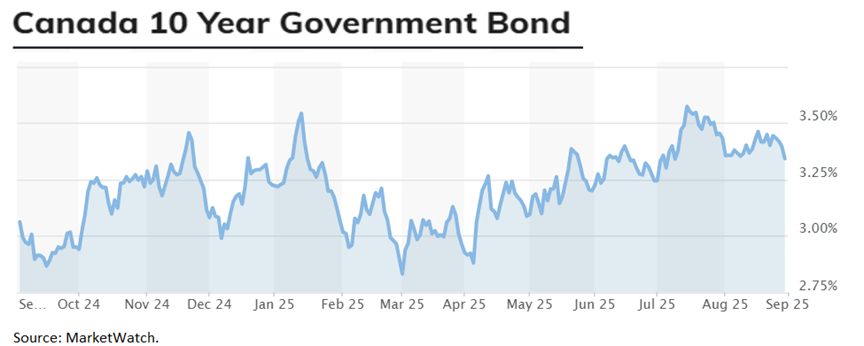
In the United States, weak job growth and lower-than-expected inflation increase the likelihood that the Fed will resume cutting rates in September. Canadian and U.S. interest rates fell during the month. As a result, the Canadian bond index returned 0.41% in July.
OUTLOOK:
Economy:
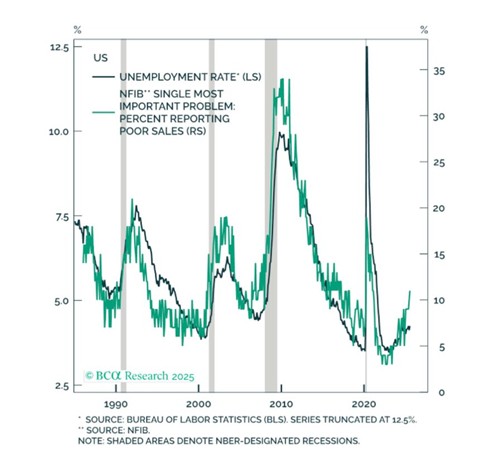
So far, the impact of tariffs remains mixed in U.S. economic data. However, several indicators show that the job market has cooled significantly. For example, more and more NFIB survey respondents report weak sales. Historically, this has been strongly correlated with unemployment.
NFIB Index (% reporting weak sales) and Unemployment: United States
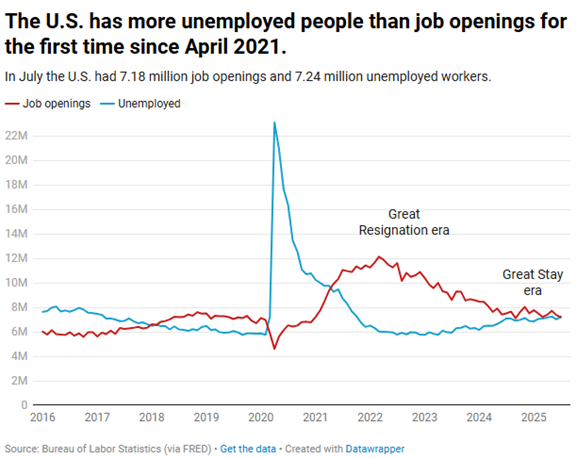
Moreover, the number of unemployed now exceeds the number of job openings. This is the first time since April 2021. An excess supply of workers means weak wage pressures. This gives the Fed ammunition to lower its key interest rate.
Job openings and unemployment (United States):
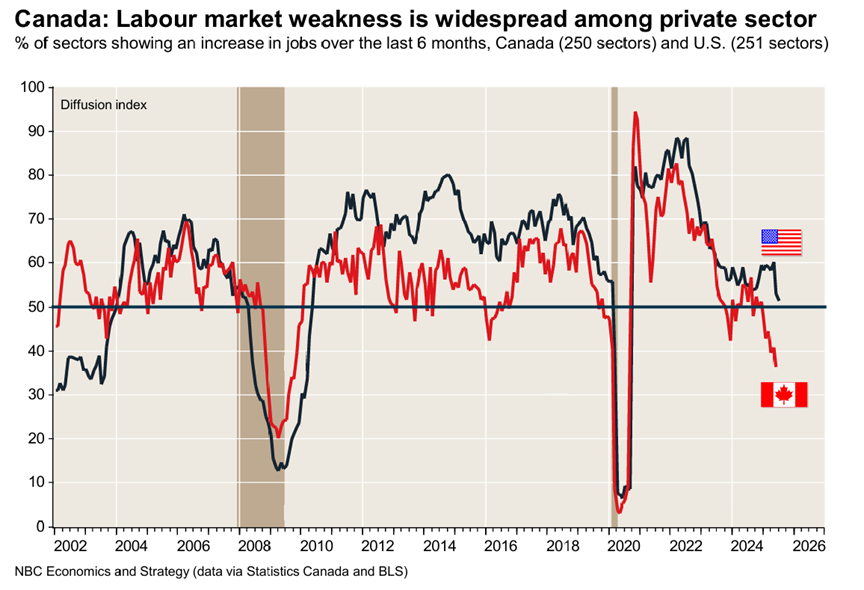
In Canada, the economy is lagging. Indeed, GDP contracted by 1.6% (annualized) in the second quarter of 2025. The main detractor was, unsurprisingly, exports. A look at the job market reveals that industries that are showing employment growth are in the minority. The current level can be described as recessionary.
Sectors of activity where employment is growing (Canada and the United States):
As misfortune never comes alone, banks usually tighten their credit conditions when employment is in a bad way. This is not surprising, as defaults are very often linked to job loss.
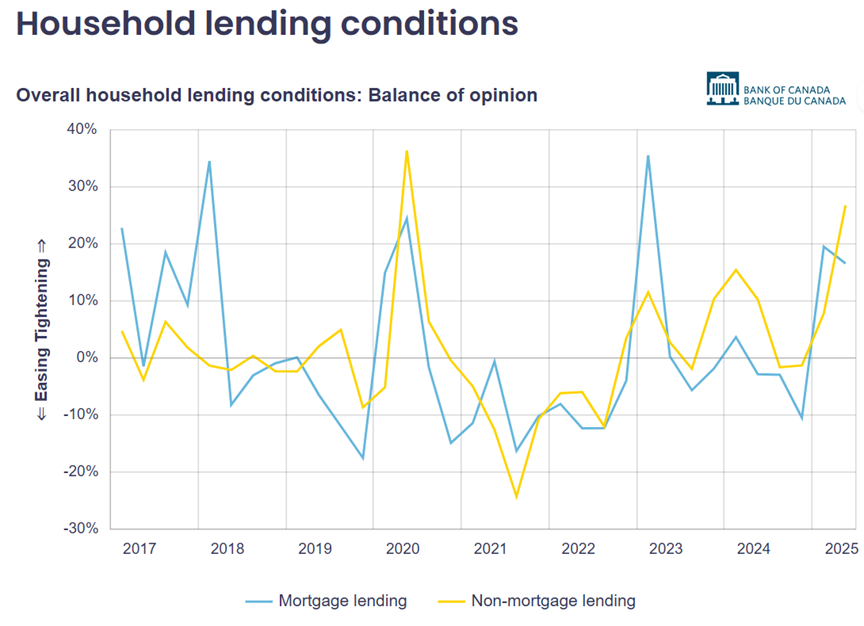
In its quarterly survey of bank credit conditions, the Bank of Canada reports that credit conditions (for all loans) have tightened. These conditions are approaching the conditions prevailing in the second quarter of 2020. This does not bode well for consumption and the real estate market.
Canadian household credit conditions:
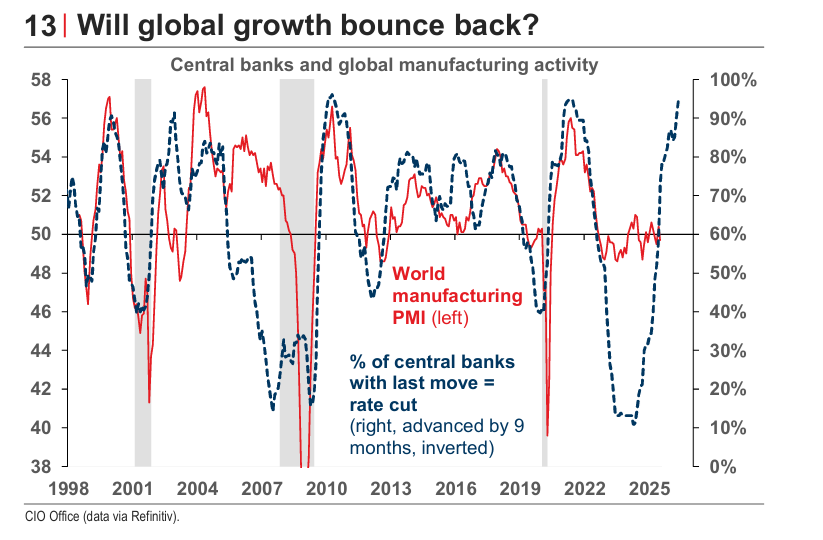
Certainly, we are seeing some weaknesses in the global economy, but the most important factor is central bank activity. Barely a year ago, central banks were a minority lowering their rates. Now, almost all of them are in easing mode. Rate cuts take 12-18 months to percolate through the economy. Therefore, we should be able to benefit from this tailwind for a few more quarters.
Central Bank Rate Cuts and Global Manufacturing Activity (Q+9M):
Fixed Income:
Now that the tariffs have been in effect for several months, we can now analyze the price trends of domestic and imported goods. We can see that prices rose rapidly after the tariffs were imposed. However, the cumulative increase remains very modest compared to other components of inflation. The apocalypse has not arrived!
Price Trends for Domestic and Imported Goods: United States

Another way to analyze inflation is to examine the total wage bill of the economy (excluding the public sector). After all, wages are a large component of business costs. Moreover, the total wage bill is a 12-month leading indicator of core inflation. Therefore, inflation is expected to stabilize around 2%. To this end, over the past six months, annualized inflation has been only 1.9%.
Total Wage Bill and Core Inflation (Q+12M): United States

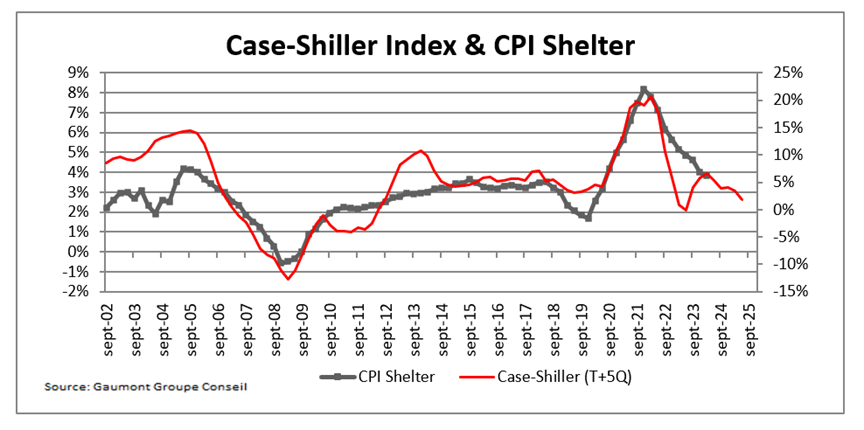
The housing component is expected to continue to slow. The Case-Shiller Housing Index has increased by 1.9% over the past 12 months, compared to a 5.4% increase last year. Moreover, the most recent quarterly (annualized) data shows a decline of 3.5%.
Case-Shiller Housing Index and CPI Housing Component: United States
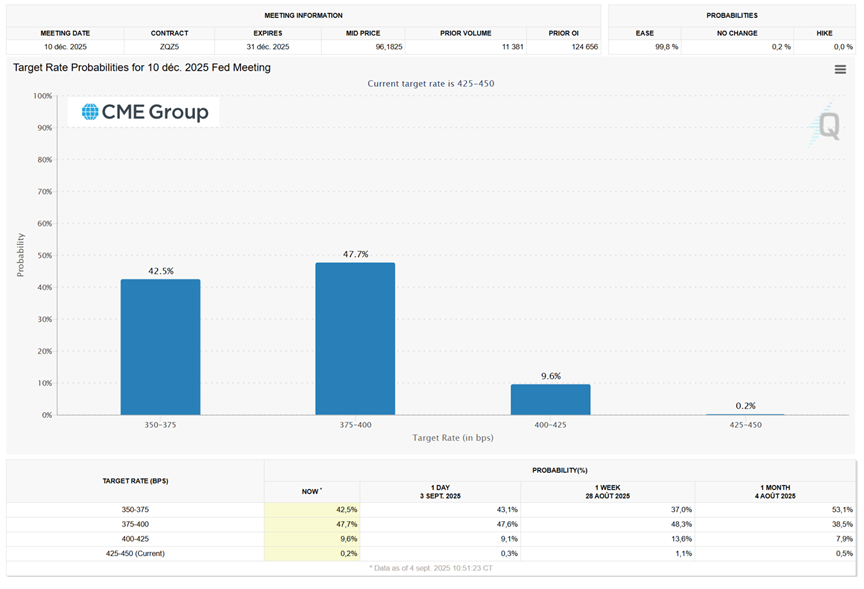
Expectations of Fed rate cuts have risen sharply in recent months. Indeed, cuts of 0.50% to 0.75% are expected by the end of 2025 and 1.26% over the next 12 months.
Remember that when inflation falls, real rates rise. This is why the Fed seems inclined to reduce its key rate.
Short-term implied interest rates (United States):
Stock Markets:
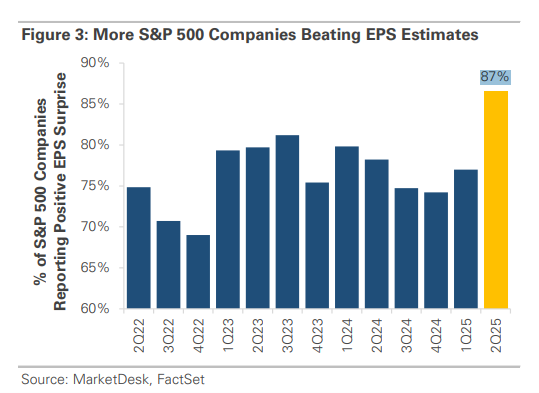
Stock market investors continue to pour money into the global stock market. Although companies reported better-than-expected earnings, the stock market has become expensive again (in contrast to April). Since its April low, the S&P 500 has gained 33%.
Percentage of S&P 500 companies beating earnings expectations:
Indeed, US stocks are expensive compared to Euro-Asian markets. The same goes for growth stocks versus value stocks, as well as large caps versus small caps.
Relative assessment of various markets:

What are sophisticated investors doing? They’ve been reducing their exposure to the stock market since April, while dumb money continues to buy aggressively.
Historically, these behaviors correlate with poor future stock market performance.
Smart money and the S&P 500:

It’s worth remembering that the historical performance from September to October is rather lackluster. We often see a recalibration of expectations, often tinged with optimism, during the summer.
Seasonal Characteristics of the S&P 500:

CONCLUSION :
The strong rebound from the April low is not justified on a fundamental basis (primarily corporate profits). A period of consolidation is to be expected. No one has become poorer by taking profits and reducing portfolio risk to its target. This is especially true given that interest rates remain attractive. It is important to keep portfolios well diversified, both geographically and with fixed-income securities. Holding quality securities is more important than ever.
Frédéric Mercier CFA, SIPC
Director – Financial markets