

FINANCIAL MARKET REVIEW:
The performance of the S&P 500 sectors (-0.9%) in October was essentially the opposite of what was seen in September. The technology (-6.8%) and communications (-15.1%) sectors ended the month deep in negative territory. All other sectors delivered positive returns in October. Anything even remotely related to artificial intelligence performed poorly. In this regard, emerging markets had a very difficult month, posting a return of -7.4%.
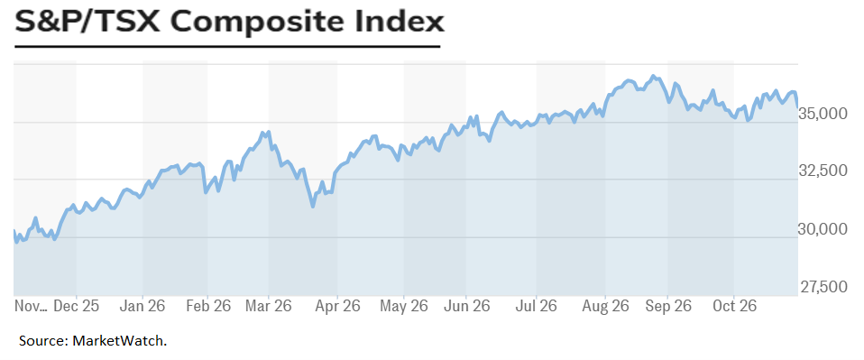
Canada, with its low weighting in the technology sector, fared well in October. The S&P/TSX Index ended the month up 1.2%. The materials sector was the only one to post a negative return for the month; the performance of the price of gold (-6.5%) was a contributing factor to this underperformance.
On October 28, the Federal Reserve kept its key interest rate unchanged. In Canada, the central bank raised its rate by 0.25% to 2.50%. The previous hike had taken place in July 2023.
Interest rates for 2-year and 10-year maturities ended the month lower. The 2-year rate fell by 0.06%, while the 10-year rate dropped by 0.20%.

Consequently, the performance of the Canadian bond index was strong, at 1.43% in October.
Oil appreciated significantly over the last month (+13.9%).
OUTLOOK:
Economy:
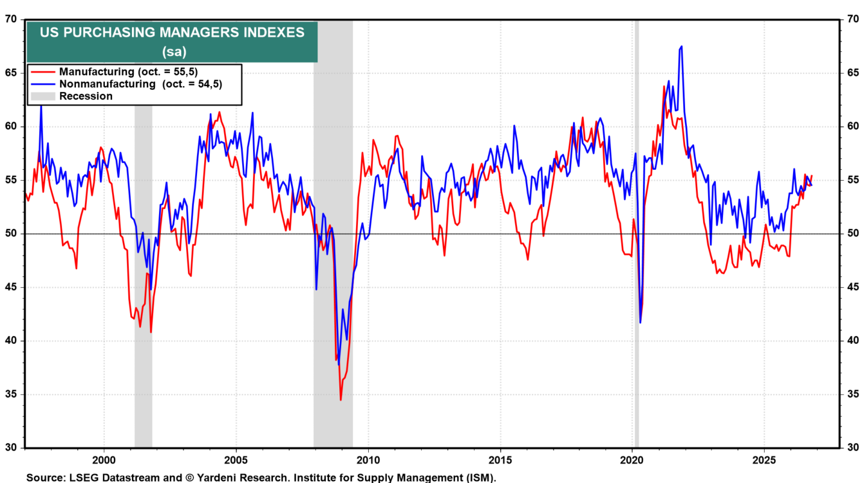
Economic growth continues unabated in the United States. In fact, annualized GDP growth reached 3.4% in the third quarter. Furthermore, the manufacturing and services PMI indices remain at levels consistent with reasonable growth.
United States PMI Indices – Manufacturing and Non-Manufacturing:
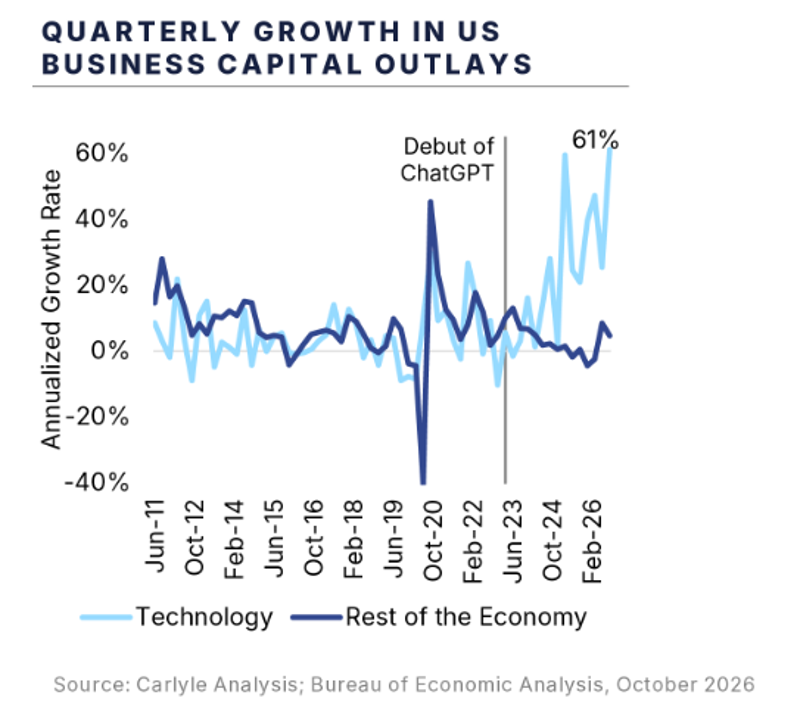
What we observe is that, over the past year, 57% of gross domestic product growth has come from (non-residential) capital investment. This sector accounts for approximately 15% of the U.S. economy. Artificial intelligence represents a major driver of growth in the United States.
Capital investment (United States):
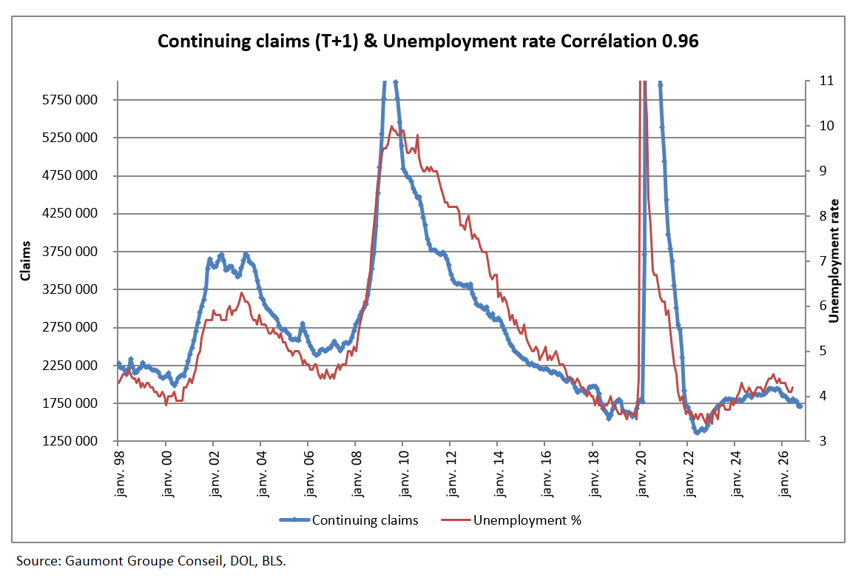
In the labor market, continuing claims for unemployment insurance benefits have been on a steady decline for the past 12 months. The unemployment rate is gradually tightening, yet wage pressures remain under control.
Continuing claims for unemployment insurance benefits and the unemployment rate (United States):
In the medium term, the recent tightening of financial conditions will take effect and act as a headwind for the economy. In this regard, it is worth noting that 10-year yields have risen by 0.85% over the past 12 months.
Financial conditions (United States):

Fixed income:
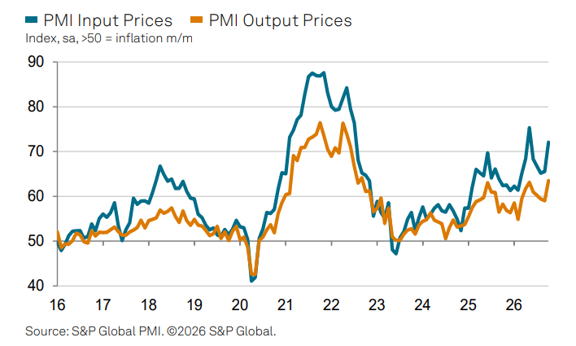
While most observers expected inflation to resume its downward trend, recent data appear to show a gradual resurgence of inflation. Price indices in the manufacturing sector point in this direction.
Manufacturing sector price indices (PMI) (United States):
The daily price index from the firm Truflation shows an acceleration in price growth since the end of September.
Truflation daily price index (United States):

Although the recent rise in prices bears watching, it should not, at this moment, be interpreted as a signal to raise the policy interest rate.
As the following chart demonstrates, cyclical inflation—inflation sensitive to general economic conditions—is near its historical average.
Acyclical inflation comprises categories that are more sensitive to industry-specific factors.
Tightening interest rates affects cyclical inflation but has little impact on what is termed acyclical inflation. Therefore, the current situation should not provide the Fed with a rationale for action.
Cyclical and acyclical inflation (United States):

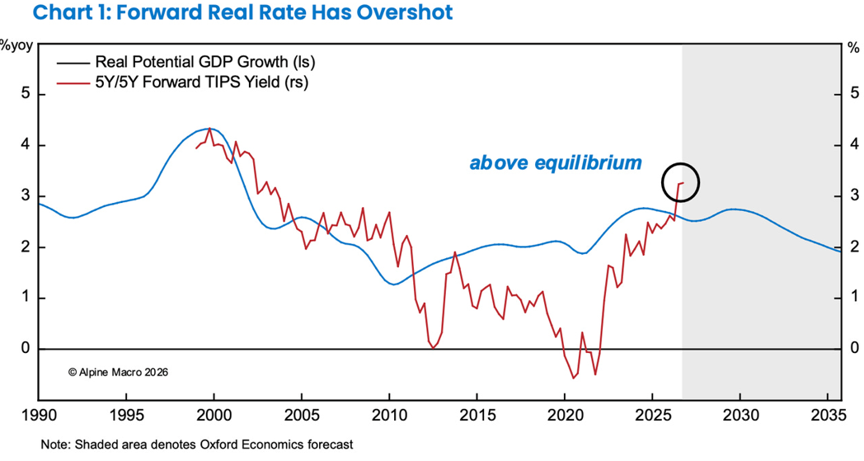
Furthermore, medium-term real interest rates already appear to be in restrictive territory relative to real GDP.
Real interest rate vs. potential GDP (United States):
Investors have lowered their expectations for interest rate hikes over the past month. Forecasts for rate increases between now and June 2027 currently stand at 0.50%, down from 0.66% on October 2.
In Canada, expectations are in a similar range, at around a 0.50% increase.
Implied short-term interest rates (United States):

Stock Markets:
Technology stocks have been particularly volatile in recent weeks. How can stocks fluctuate so significantly when corporate earnings are only reported on a quarterly basis? One possible explanation lies in the level of leverage within the financial system. This has surged in recent years, amplifying both upward and downward market movements.
The following chart illustrates the extreme liquidation of positions that took place in October.
Deleveraging by hedge funds:

This extreme sell-off occurred at a time when companies were releasing their earnings results—a period during which they are prohibited from repurchasing their own shares. The absence of these buyers only exacerbated the decline in stock prices.
Share Buyback Blackout Period (United States):

Now that these two phenomena—along with the midterm elections—are behind us, the stage is set for the stock market to resume its upward trajectory.
While the impact of artificial intelligence may be difficult to quantify, the notion that we are witnessing a bubble comparable to the one in 2000 simply does not hold water. Let’s look at the following chart to see why.
In 2000, stock prices were soaring while earnings failed to keep pace, resulting in absurdly high price-to-earnings (P/E) multiples.
Currently, the prices of technology stocks are rising less rapidly than their earnings. In fact, these multiples are contracting!
Performance of the technology sector: 2000 cycle vs. the current cycle

What we are witnessing is a sector rotation. People are selling their technology stocks to buy « safe-haven » stocks. When everyone does the same thing—without looking at the fundamentals—it creates temporary aberrations.
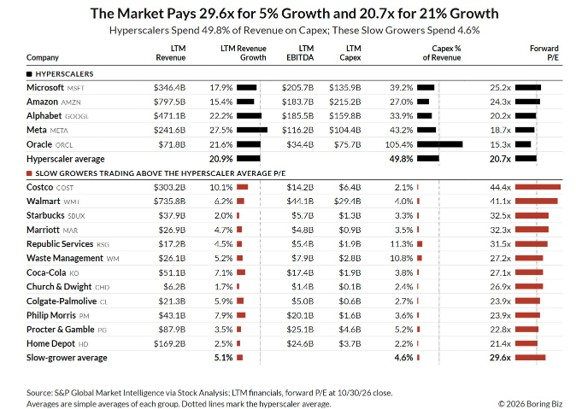
The following table compares cloud giants with a group of safe-haven, low-growth stocks.
Cloud giants are trading at 20.7x earnings, with a projected revenue growth of 20.9%. The group of safe-haven stocks is trading at 29.6x earnings, with a projected growth rate of 5.1%.
While these figures are inherently uncertain, the safe-haven stocks appear excessively expensive compared to the cloud giants.
This example illustrates that an investor who reacts to market volatility without understanding the fundamentals is destined to underperform.
Valuation of safe-haven stocks vs. cloud giants:
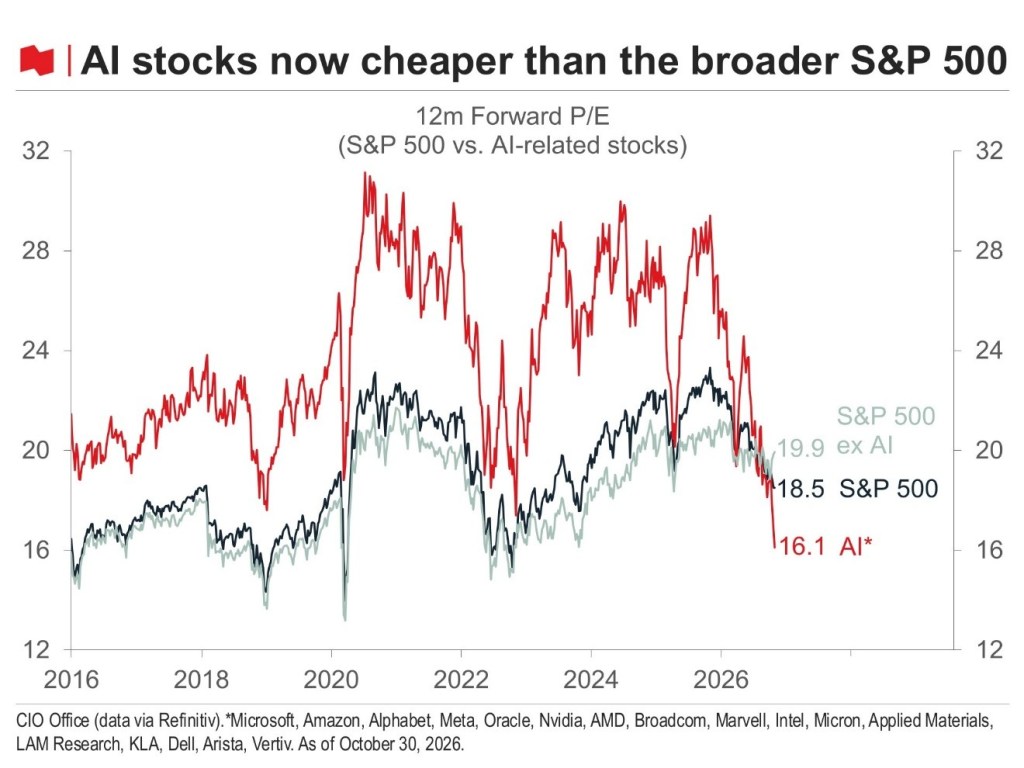
Stocks related to intelligence are currently less expensive than the S&P 500 index!
Price-to-earnings ratio of the U.S. stock market:
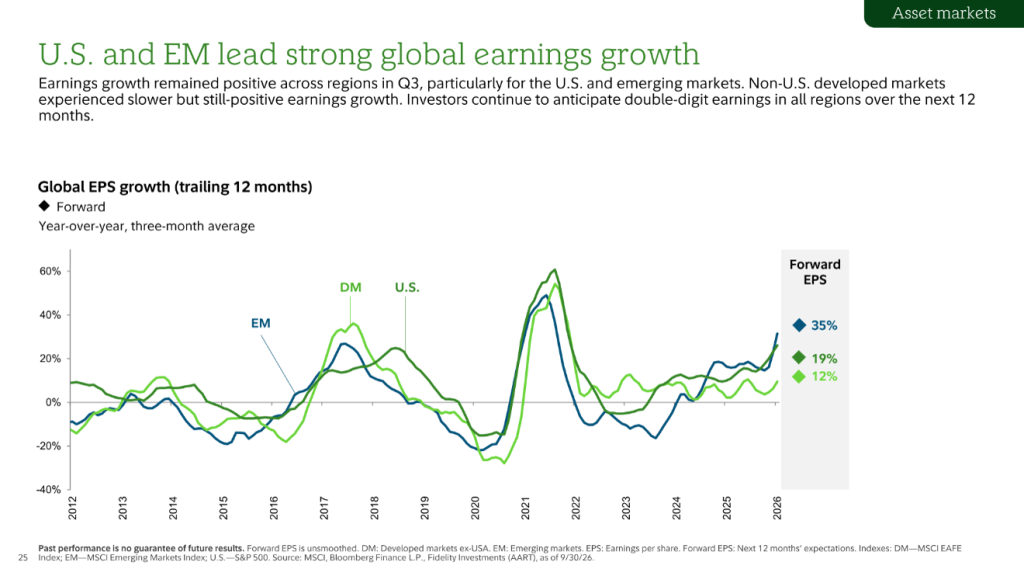
Beyond the volatility inherent in stock markets, the outlook for corporate profit growth remains excellent worldwide. This should translate into growth for market indices in the coming months.
Projected profit growth in the United States and emerging markets:
CONCLUSION:
Corporate profit growth remains strong and will serve as a tailwind for global stock markets. We should stick with high-quality stocks, while keeping a close eye on the valuation multiples being paid. With their high yields, bonds remain an attractive component of a balanced portfolio.
Frédéric Mercier CFA, SIPC
Director – Financial Markets